

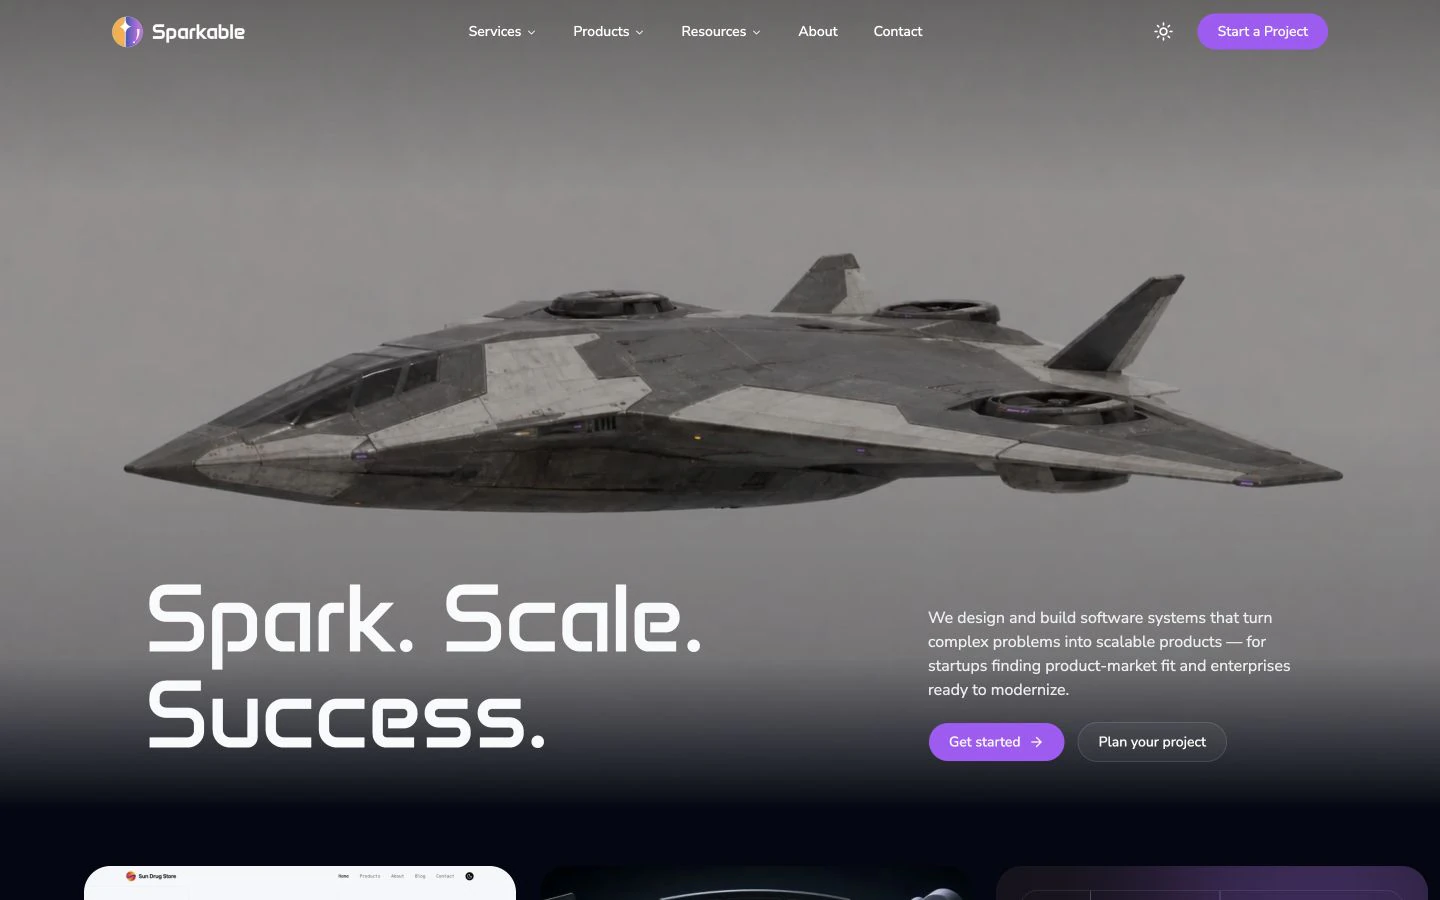
This homepage performance case study explains how we moved Sparkable’s mobile PageSpeed score from 42 to a three-run median of 93 without removing the new visual design.
The final desktop median was 95. Median mobile Total Blocking Time fell from 32,750 milliseconds to 100 milliseconds. Median desktop Total Blocking Time fell from 20,640 milliseconds to 170 milliseconds.
Those numbers are the clean summary. The work was not clean.
Our first major redesign removed the worst JavaScript bottleneck, but it replaced a CPU problem with an 8.15 MB hero video. Mobile Largest Contentful Paint rose from 4.8 seconds to 7.8 seconds. A later PageSpeed run scored the finished site at 97 on mobile, while another run of the same build scored 76. Pingdom reported a 353.2 KB page because it completed before the deferred video and one analytics payload loaded.
We kept every result. The slow runs matter as much as the green ones.
| Project snapshot | Detail |
|---|---|
| Client | Sparkable, our own website |
| Stack | Astro 5, React 19, Tailwind CSS 4, Cloudflare |
| Scope | Homepage architecture, media delivery, hydration, images, caching, and interaction lifecycle |
| Constraint | Preserve the approved copy, visual hierarchy, spacing, colours, breakpoints, video framing, navigation, analytics, carousels, and footer behavior |
| Before measurement | PageSpeed on 31 August 2026, plus a Pingdom HAR from San Francisco |
| After measurement | Three PageSpeed runs per device, three DataForSEO Lighthouse runs, a new Pingdom HAR, direct headers, and current site screenshots |
| Verified lab outcome | PageSpeed median 93 mobile and 95 desktop |
| Strongest change | Mobile median TBT fell 99.7%; desktop median TBT fell 99.2% |
| Evidence boundary | PageSpeed reported no field data. We make no traffic, ranking, conversion, lead, or revenue claim |
We preserved two dated evidence packs with screenshots, raw HAR files, request tables, machine-readable JSON, and checksums. Every result in this case study comes from those files, current source, Git history, or a new media inspection.
The homepage looked fast before the browser started working
The original homepage used a particle galaxy as its main visual. The server delivered the files quickly. Pingdom measured 858.7 KB through ten requests in 256 milliseconds from San Francisco and gave the page a B88 grade.
PageSpeed told a different story.
| Original lab metric | Desktop | Mobile |
|---|---|---|
| Performance score | 56 | 42 |
| First Contentful Paint | 0.5 s | 2.1 s |
| Largest Contentful Paint | 1.4 s | 4.8 s |
| Total Blocking Time | 20,640 ms | 32,750 ms |
| Cumulative Layout Shift | 0.007 | 0 |
| Speed Index | 10.9 s | 8.5 s |
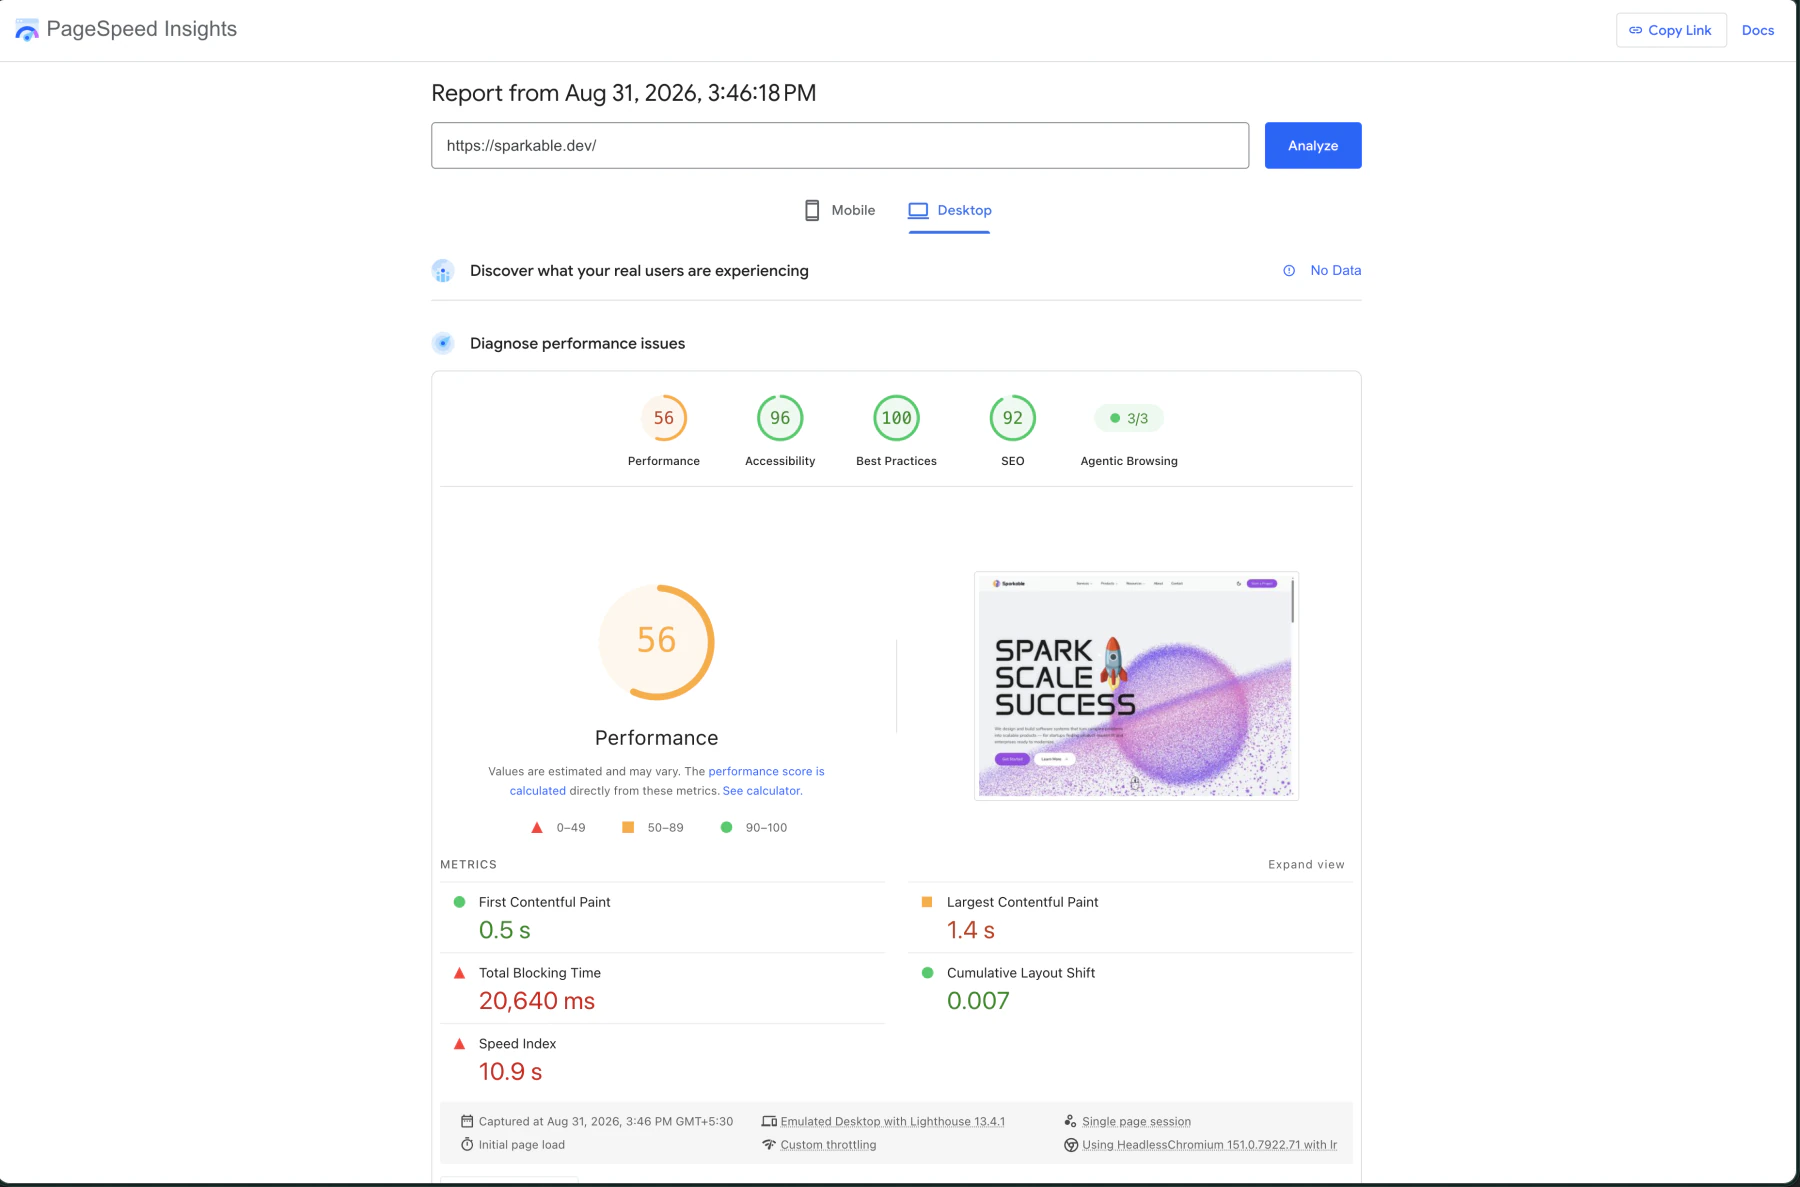
Pingdom and PageSpeed were not contradicting each other. They measured different work.
Pingdom recorded a short network waterfall. Lighthouse loaded the page under a controlled device and network profile, then executed the JavaScript. The files arrived quickly, but the main thread remained busy.
This distinction shaped the whole project. A smaller transfer does not guarantee a responsive page. A green PageSpeed score does not prove that real users have a good experience. Google describes lab data as a controlled synthetic measurement and field data as a distribution of real visits across devices, networks, locations, and behavior. Both matter, and one cannot replace the other. Read Google’s explanation of lab and field data.
PageSpeed had no Chrome User Experience Report data for sparkable.dev. We therefore had lab evidence for diagnosis, but no field Core Web Vitals and no verified business outcome.
The source explained the 32.75 second TBT
The old deployed bundle repeatedly named in PageSpeed was NovaPointsGalaxy.DZMAEkTC.js. The matching source made the cost understandable.
The component selected 70,000 particles for mobile and 200,000 for desktop. It created that set, then pushed the same number of points into the geometry again. The result was about 140,000 mobile points and 400,000 desktop points. The component also created size and shift arrays and ran an unrestricted requestAnimationFrame render loop.
The visual was doing exactly what the code asked it to do. The problem was the amount of work and the fact that it never stopped.
The homepage architecture amplified that cost. src/pages/index.astro rendered the entire page as one React island:
<HomePage client:load />That decision made the hero, portfolio, comparison table, reviews, theme observers, scroll state, and terminal animation part of one eager hydration boundary. The browser started that work during the initial page load.
PageSpeed’s old long-task table repeatedly assigned work to both the galaxy bundle and the shared client bundle. The evidence was unusually direct: the trace named the bundles, and the source showed why those bundles stayed active.
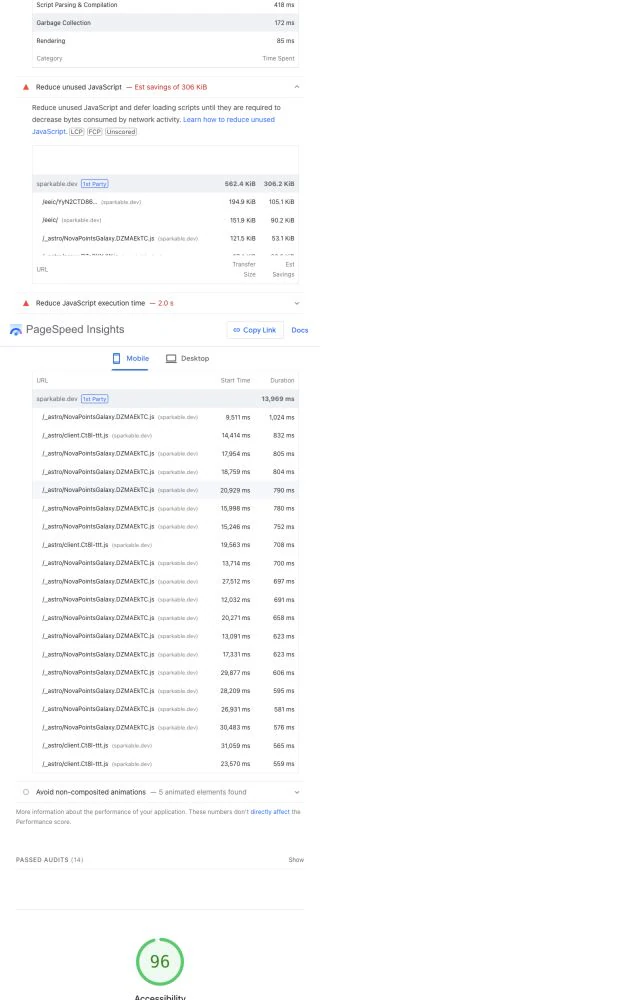
Total Blocking Time is easy to misstate. TBT is the sum of the blocking portion of main-thread tasks longer than 50 milliseconds. It is a lab proxy for responsiveness. It does not mean that a user waited 32.75 seconds for the page to load. The Mercado Libre performance team used the same distinction when it treated TBT as a lab proxy and long-task diagnostic, not a field interaction metric. Read the Mercado Libre TBT case study.
The visual redesign fixed one problem and created another
We first changed the homepage design and removed the galaxy from the active composition. The new direction used a ten-second spacecraft video, simpler section backgrounds, a portfolio carousel, a static comparison story, social proof, and a final call to action.
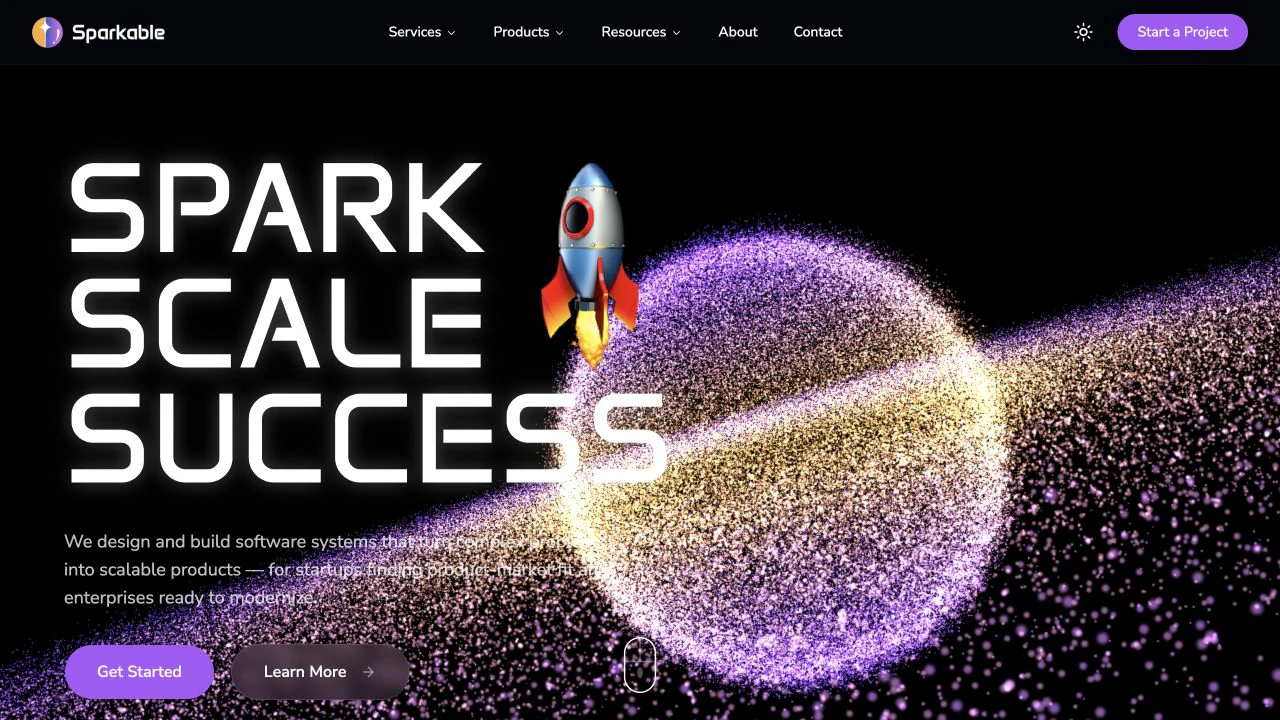
Original galaxy homepage.
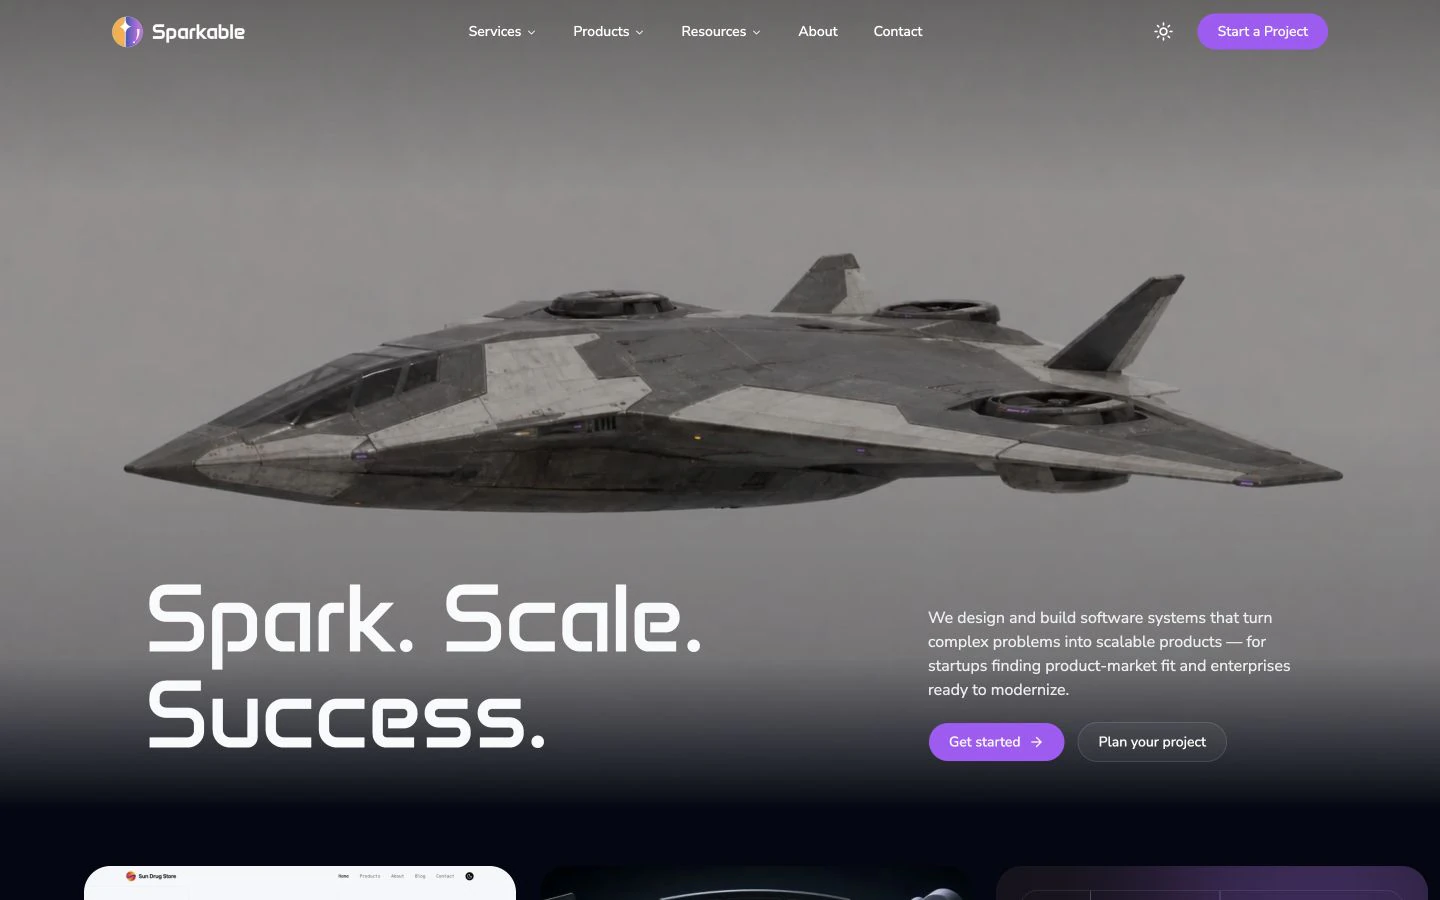
Current spacecraft homepage.
The main-thread result improved immediately.
| Redesign lab metric | Desktop | Mobile |
|---|---|---|
| Performance score | 84 | 64 |
| First Contentful Paint | 0.5 s | 3.2 s |
| Largest Contentful Paint | 1.2 s | 7.8 s |
| Total Blocking Time | 300 ms | 90 ms |
| Cumulative Layout Shift | 0 | 0 |
| Speed Index | 1.3 s | 6.1 s |
Desktop moved in the right direction. Mobile did not.
The 90 millisecond mobile TBT confirmed that removing the continuous galaxy work mattered. The 7.8 second mobile LCP showed that we had moved the bottleneck into the network and rendering path.
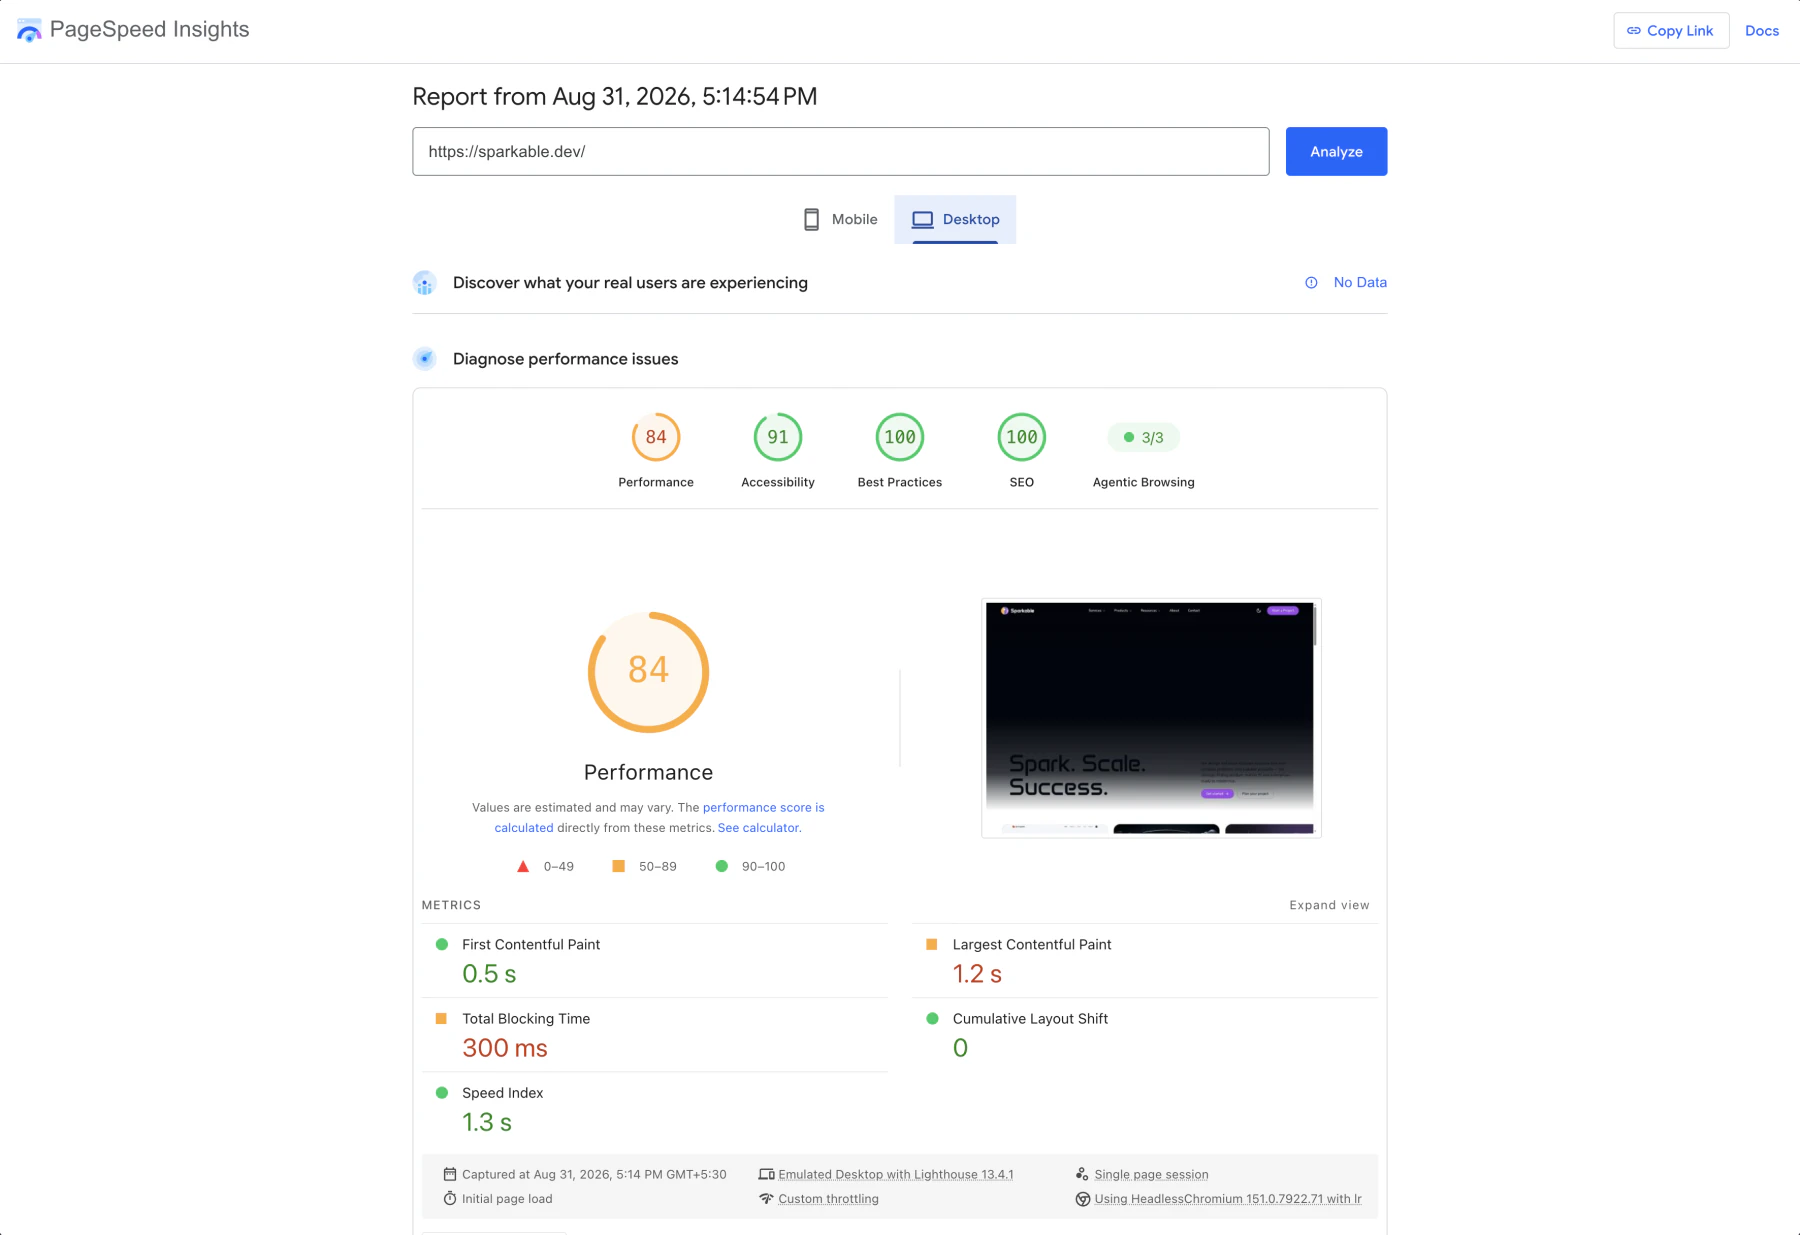
Desktop reached 84 with 300 ms TBT.
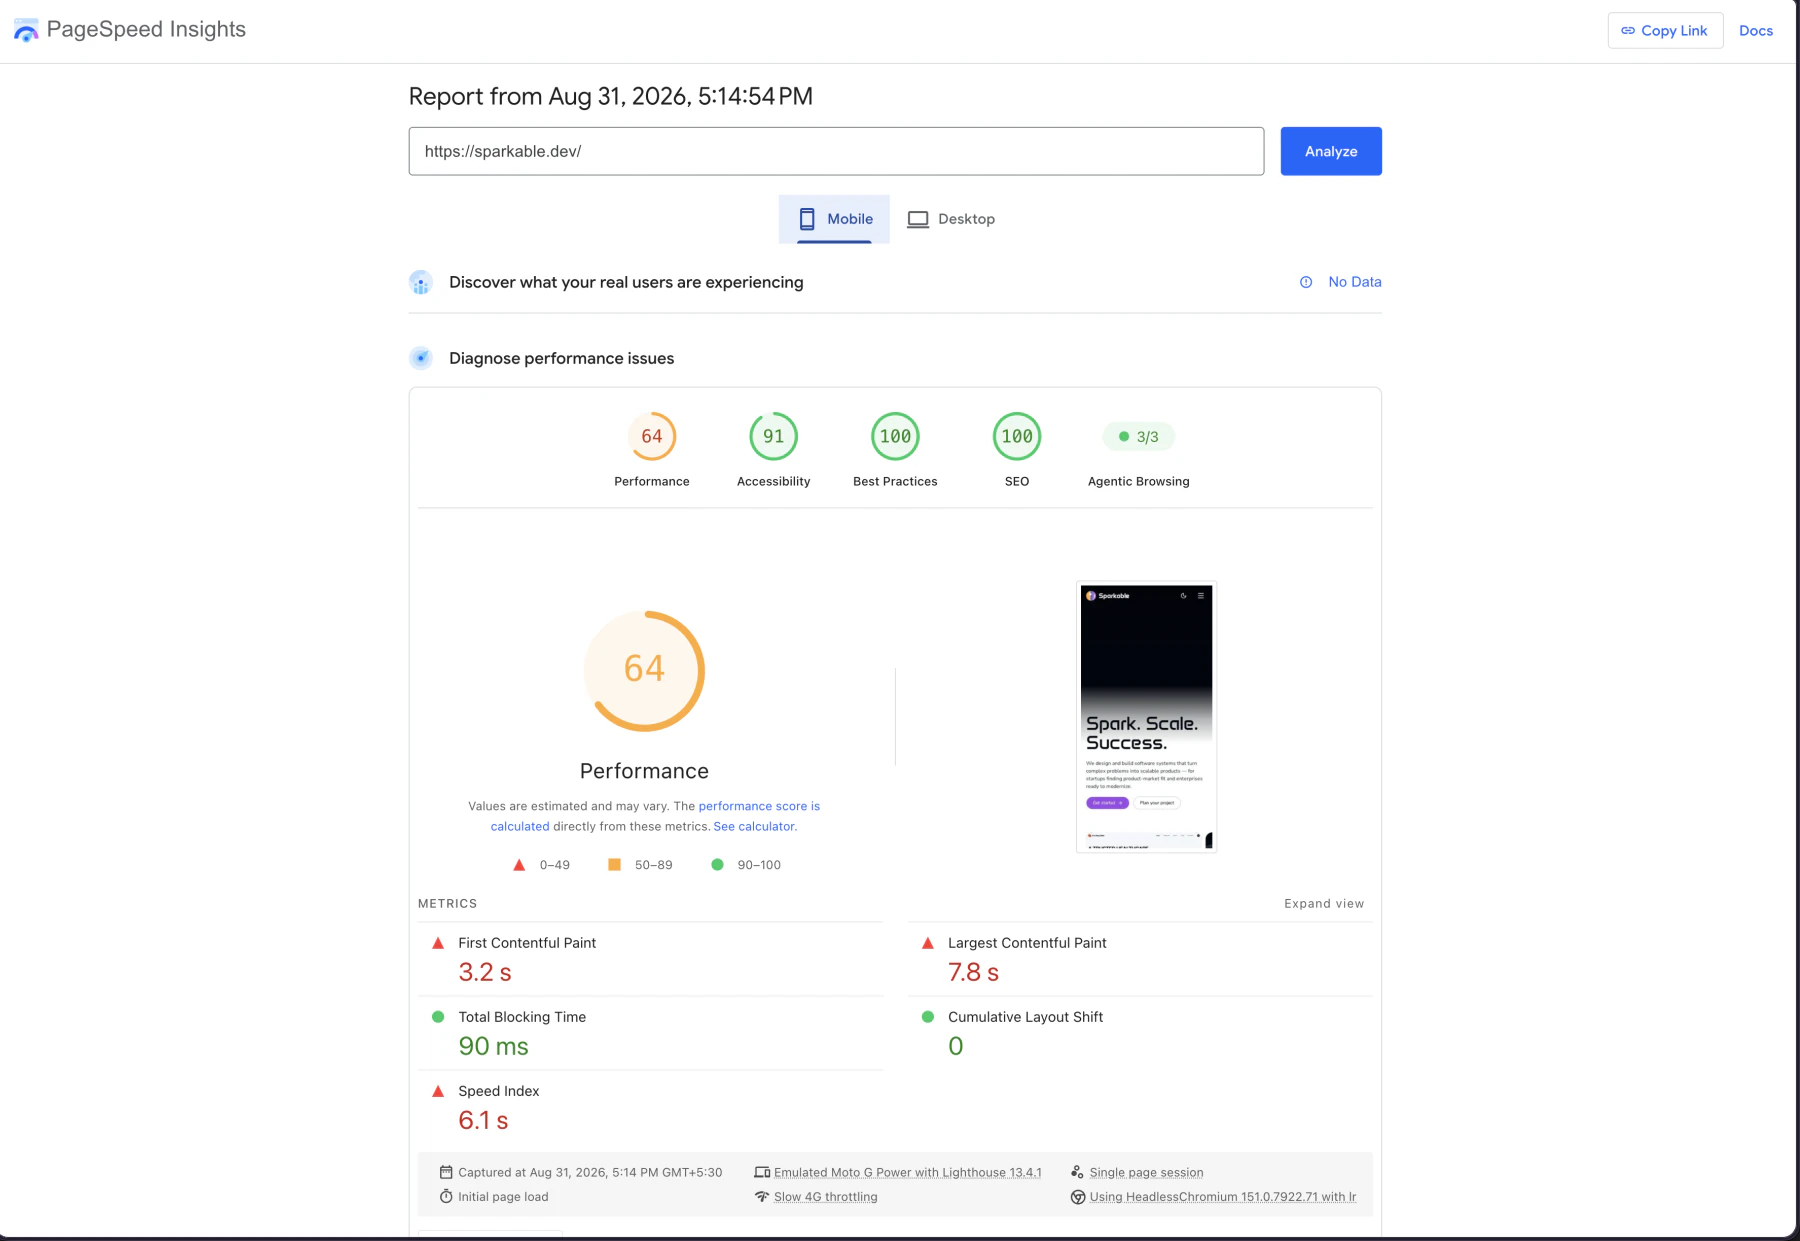
Mobile reached 64, but LCP increased to 7.8 seconds.
The supplied Pingdom HAR explained the regression. It recorded 9,181,417 response-body bytes. The hero video alone transferred 8,150,908 bytes. The old founder image added 593,379 bytes.
The video was the right visual and the wrong file.
This became the central constraint for the performance pass: keep the spacecraft, the crop, the overlay, the transitions, the copy, and the interaction. Change how the browser discovers, downloads, decodes, and stops the media.
We defined the visual contract before changing the architecture
Performance work can become a quiet redesign. A developer removes animation, collapses spacing, swaps imagery, or deletes an interactive section, then reports a faster score for a different page.
We did not allow that trade.
The approved contract kept:
- the
Spark. Scale. Success.hero and both calls to action; - the spacecraft animation, framing, crop, autoplay, mute, loop, and inline playback;
- the portfolio cards, swipe behavior, arrows, states, and links;
- the comparison reveal;
- the Google review loading and expansion behavior;
- the terminal animation on desktop;
- the header overlay, scroll treatment, theme toggle, and mobile menu;
- the footer reveal and Astro navigation;
- the existing analytics and review integrations.
We also stayed on Astro 5, React 19, Tailwind CSS 4, and the existing Cloudflare deployment. A framework upgrade would have changed too many variables at once.
First pass: make static HTML the default again
Astro’s main performance advantage is its island model. We were not using it on the homepage.
We replaced HomePage.tsx with HomePage.astro. The hero and comparison table also moved from React to Astro. Static copy, layout, and visual structure now ship as HTML and CSS without requiring React to recreate the page in the browser.
The remaining React components became bounded islands:
<Portfolio client:visible={{ rootMargin: '200px' }} />

<SocialProofSection
  client:visible={{ rootMargin: '400px' }}
  founderImage={founderImage}
/>

<TerminalAsciiArt client:visible={{ rootMargin: '300px' }} />
The root margins start hydration shortly before each section enters the viewport. The server-rendered structure prevents blank gaps while the JavaScript waits.
The terminal stays inside a desktop-only container. On mobile, the hidden container never becomes visible, so the terminal island does not load or run. On desktop, an IntersectionObserver and visibilitychange handler stop its animation when it leaves the viewport or the tab becomes hidden.
The comparison table became static Astro markup with a small observer for its reveal effect. We kept the effect without shipping a React component for a table that does not need application state.
This change did not remove React from the homepage. The portfolio and reviews still need it. The final network evidence records a 57.4 KB compressed shared React runtime plus the smaller island modules. The difference is that React now loads for specific interactions, not as the owner of the complete page.
First pass: replace one large video with two deliberate files
The original hero file was 10.08 seconds of 1920 by 1080 HEVC video in 10-bit YUV. It ran at 24 frames per second, included AAC audio that the muted hero never used, placed its moov metadata after the media data, and occupied 8,141,438 bytes.
We produced two H.264 files and one poster:
| Hero asset | Dimensions | Codec | Audio | Size | Reduction from original |
|---|---|---|---|---|---|
| Original video | 1920 by 1080 | HEVC, 10-bit | AAC | 8,141,438 B | Baseline |
| Desktop video | 1920 by 1080 | H.264, YUV420p | None | 1,158,922 B | 85.8% |
| Mobile video | 854 by 480 | H.264, YUV420p | None | 304,953 B | 96.3% |
| Poster | 1280 by 720 | WebP | Not applicable | 18,256 B | New LCP asset |
Both videos retain the 24 frame per second rate and ten-second content. Their moov atoms appear before mdat, so playback metadata is available at the start of the file.
We compared the new files against the original with FFmpeg SSIM. Desktop scored 0.994871. Mobile scored 0.989166 after the original was resized to the mobile frame. Those measurements supported the visual review. They did not replace it.
This approach follows the same broad lesson described in YouTube’s public performance work: a video page still needs an early, well-chosen poster, and modules that are not needed immediately should load later. Read YouTube’s performance case study.
First pass: make every homepage image match its job
The old founder image was 1,939 by 2,071 pixels and transferred 578.6 KiB in the original PageSpeed run. It displayed at about 524 by 560 pixels. PageSpeed estimated 536.3 KiB of savings.
We replaced it with 640 and 960 pixel WebP derivatives. The smaller file is 38,710 bytes and the larger file is 83,256 bytes. The social-proof island receives a typed srcSet and sizes descriptor, then loads the image lazily with asynchronous decoding and low fetch priority.
The final PageSpeed image audit reports the selected founder file at 37.8 KiB with 12.4 KiB estimated savings. The hero poster and portfolio images no longer appear in that audit.
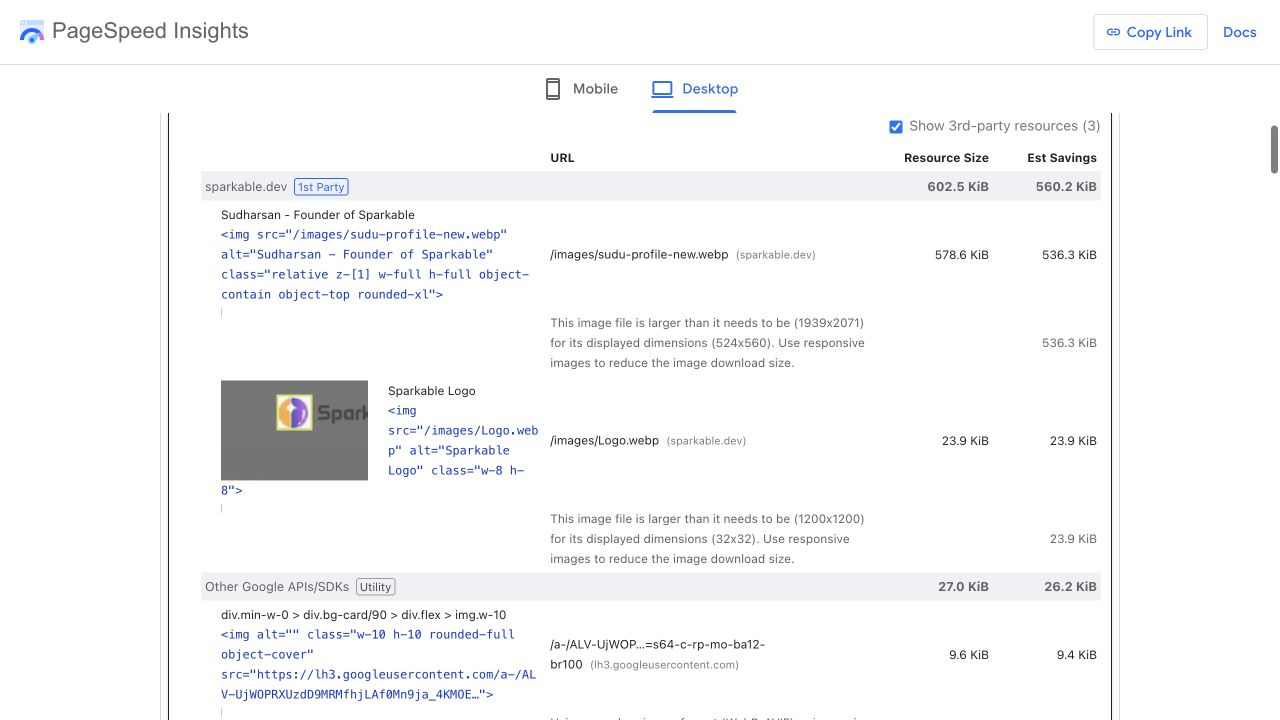
Before: 586 KiB of estimated desktop image savings.
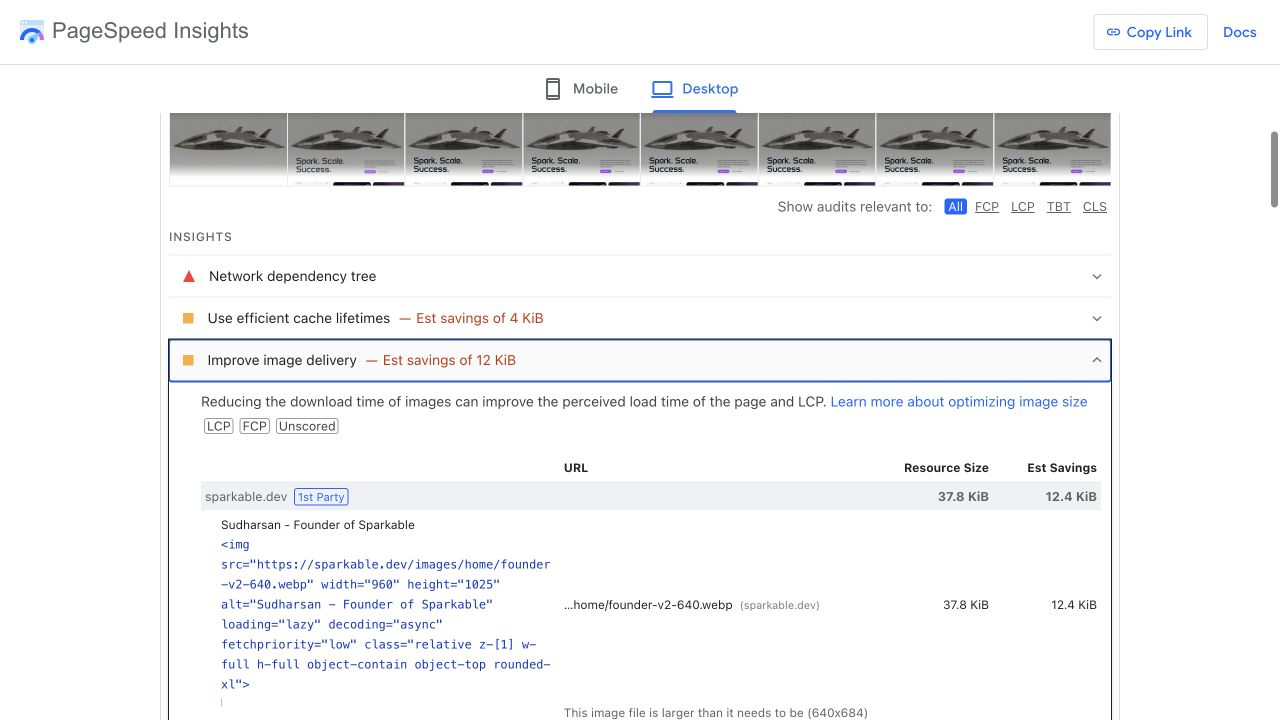
After: 12.4 KiB of estimated desktop image savings.
The two portfolio images received 480 and 800 pixel candidates, explicit dimensions, srcset, sizes, lazy loading, asynchronous decoding, and low fetch priority.
The header and footer stopped using the 1,200 by 1,200 metadata logo for a 32 pixel mark. A separate 64 pixel UI asset weighs 1,594 bytes. The larger logo remains available for metadata and structured data.
First pass: make repeat visits cheaper
The original site returned public, max-age=0, must-revalidate for HTML, hashed Astro assets, and first-party media. Cloudflare could serve an edge hit, but the browser still had to revalidate those files.
We added explicit Cloudflare rules:
/_astro/*
  Cache-Control: public, max-age=31536000, immutable

/videos/hero-spaceship-v2-*
  Cache-Control: public, max-age=31536000, immutable

/images/home/*
  Cache-Control: public, max-age=31536000, immutable
HTML still revalidates. Versioned media and hashed build assets now use a one-year immutable browser-cache policy. The final live header capture confirms those values.
First pass: remove only dead code we could prove was dead
Performance cleanup can turn into speculative deletion. We limited it to the files displaced by the new path:
- the original 8.14 MB hero video;
- an unused 9.51 MB alternate hero video;
- two unused hero-concept PNG files;
- the generated Hero29 React wrapper, navbar, social icons, and private logo chain;
- the unused Sheet component pulled in by that chain;
- the React versions of the homepage, hero, and comparison table.
We kept NovaPointsGalaxy.tsx. The homepage no longer renders it, but source comments reserve it for possible future use. Removing an inactive component from the repository would not make the deployed homepage faster.
The first optimization pass was good, not finished
The first performance release produced another clear improvement:
| First-pass lab metric | Desktop | Mobile |
|---|---|---|
| Performance score | 90 | 83 |
| First Contentful Paint | 0.5 s | 1.7 s |
| Largest Contentful Paint | 0.7 s | 3.4 s |
| Total Blocking Time | 130 ms | 70 ms |
| Cumulative Layout Shift | 0.004 | 0.001 |
| Speed Index | 3.1 s | 7.9 s |
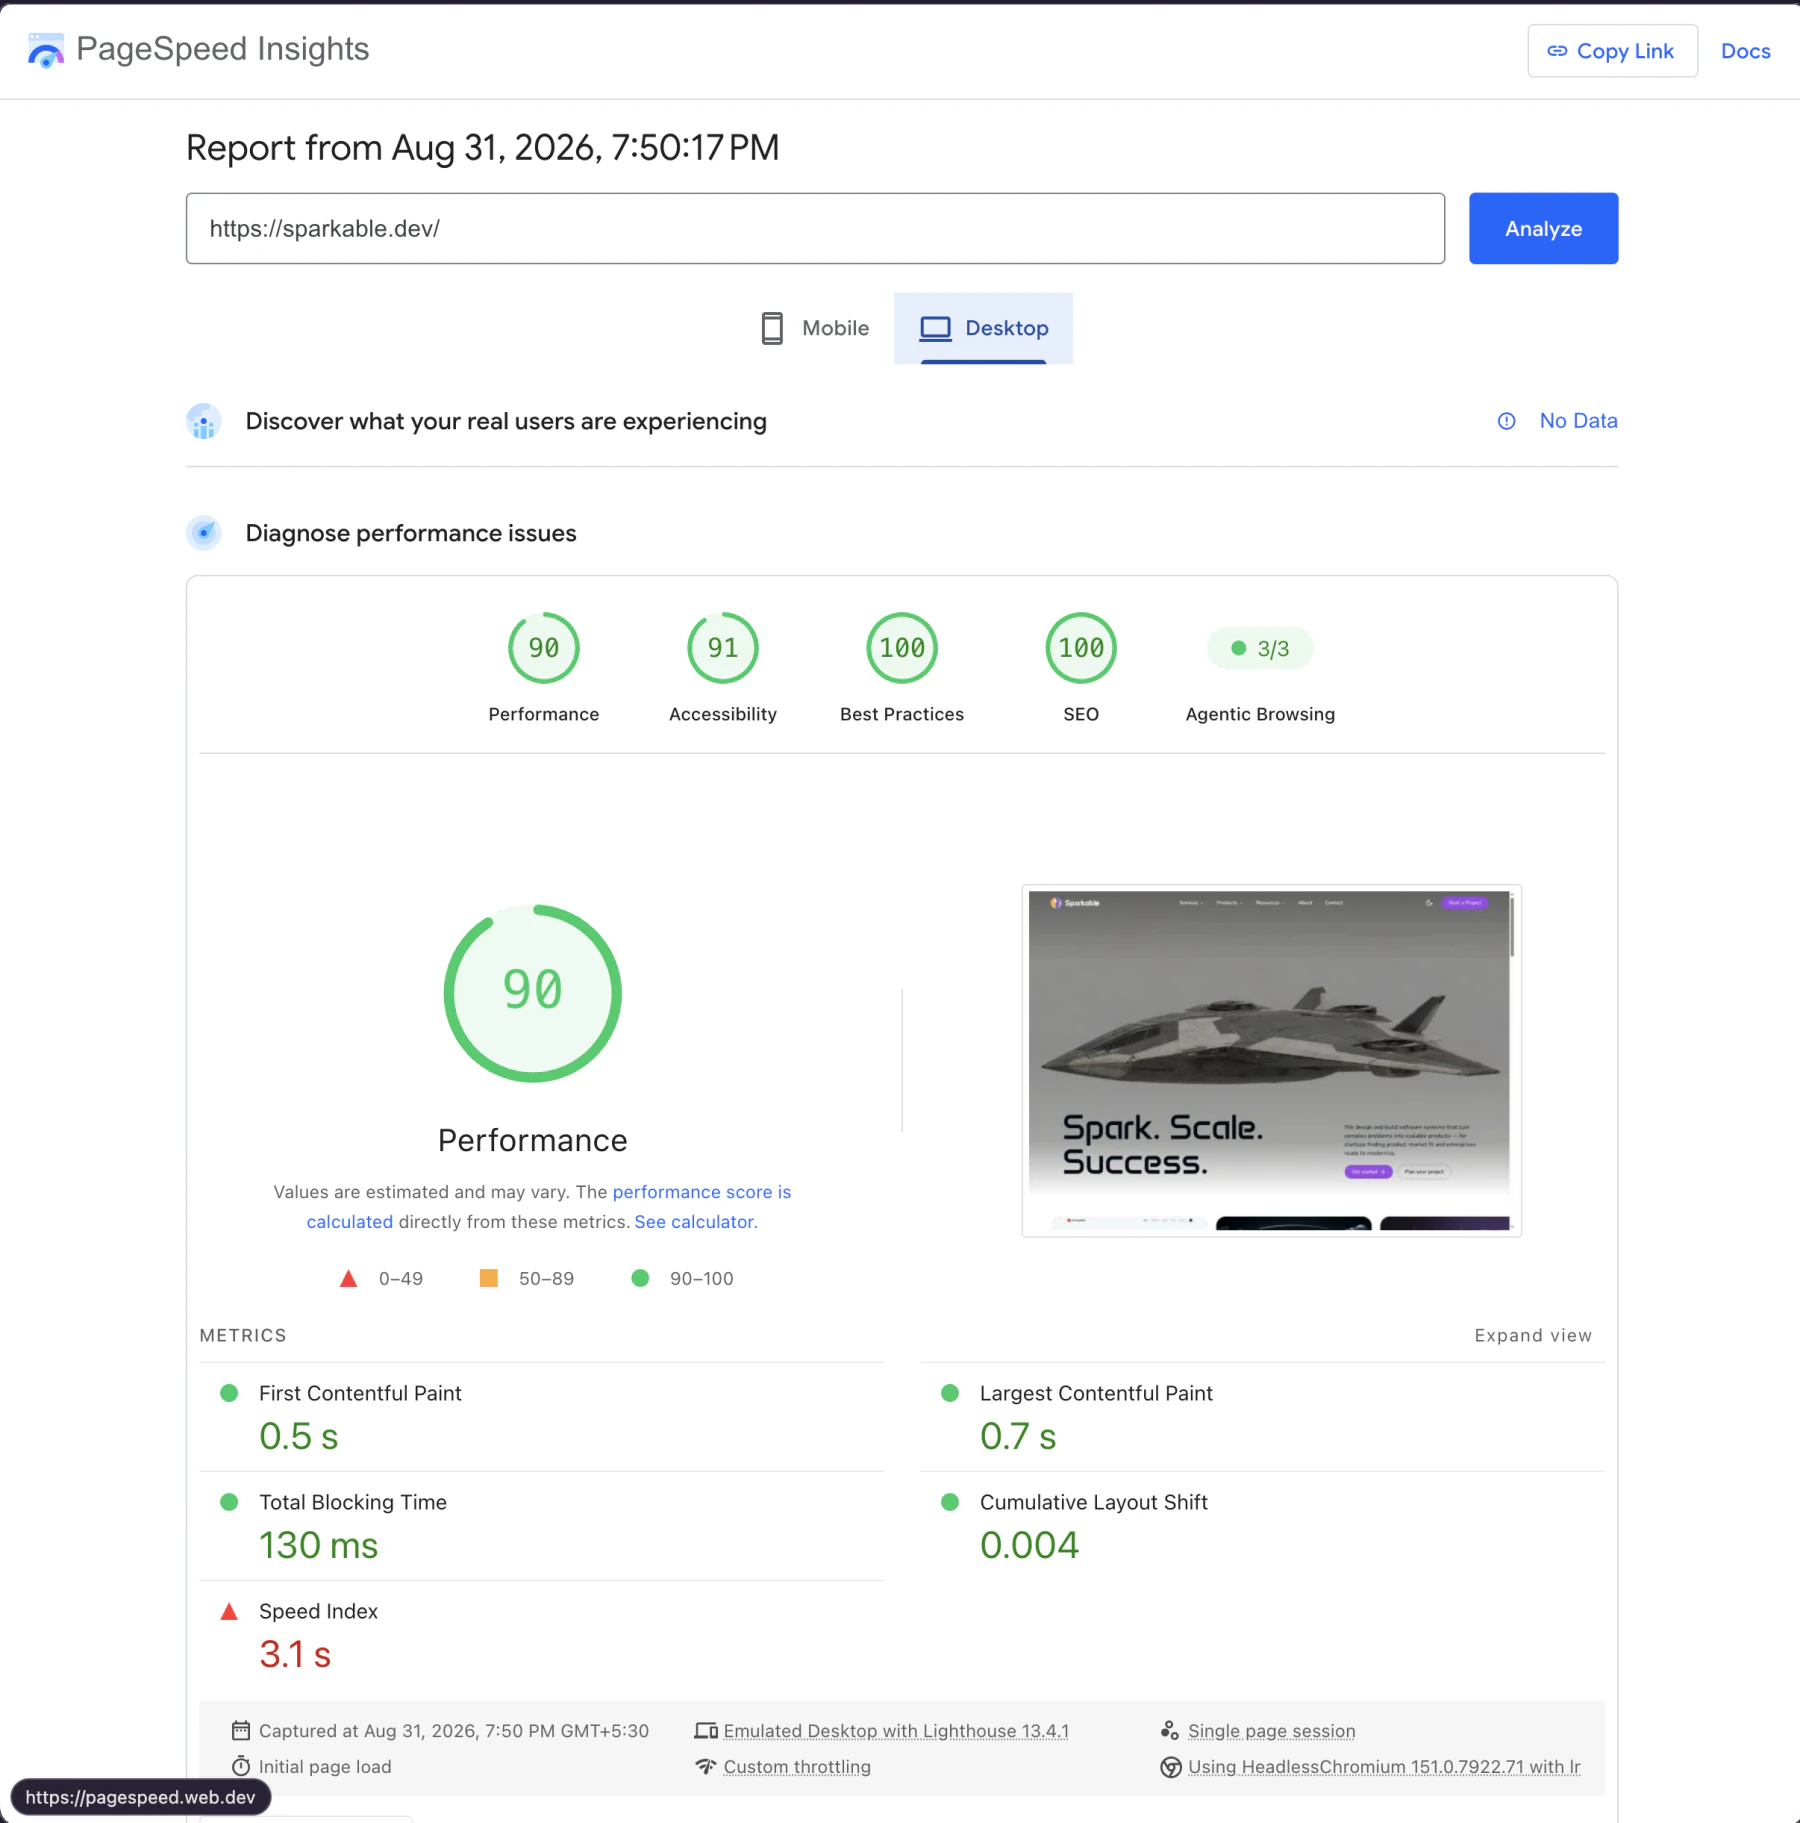
Desktop entered the green range.
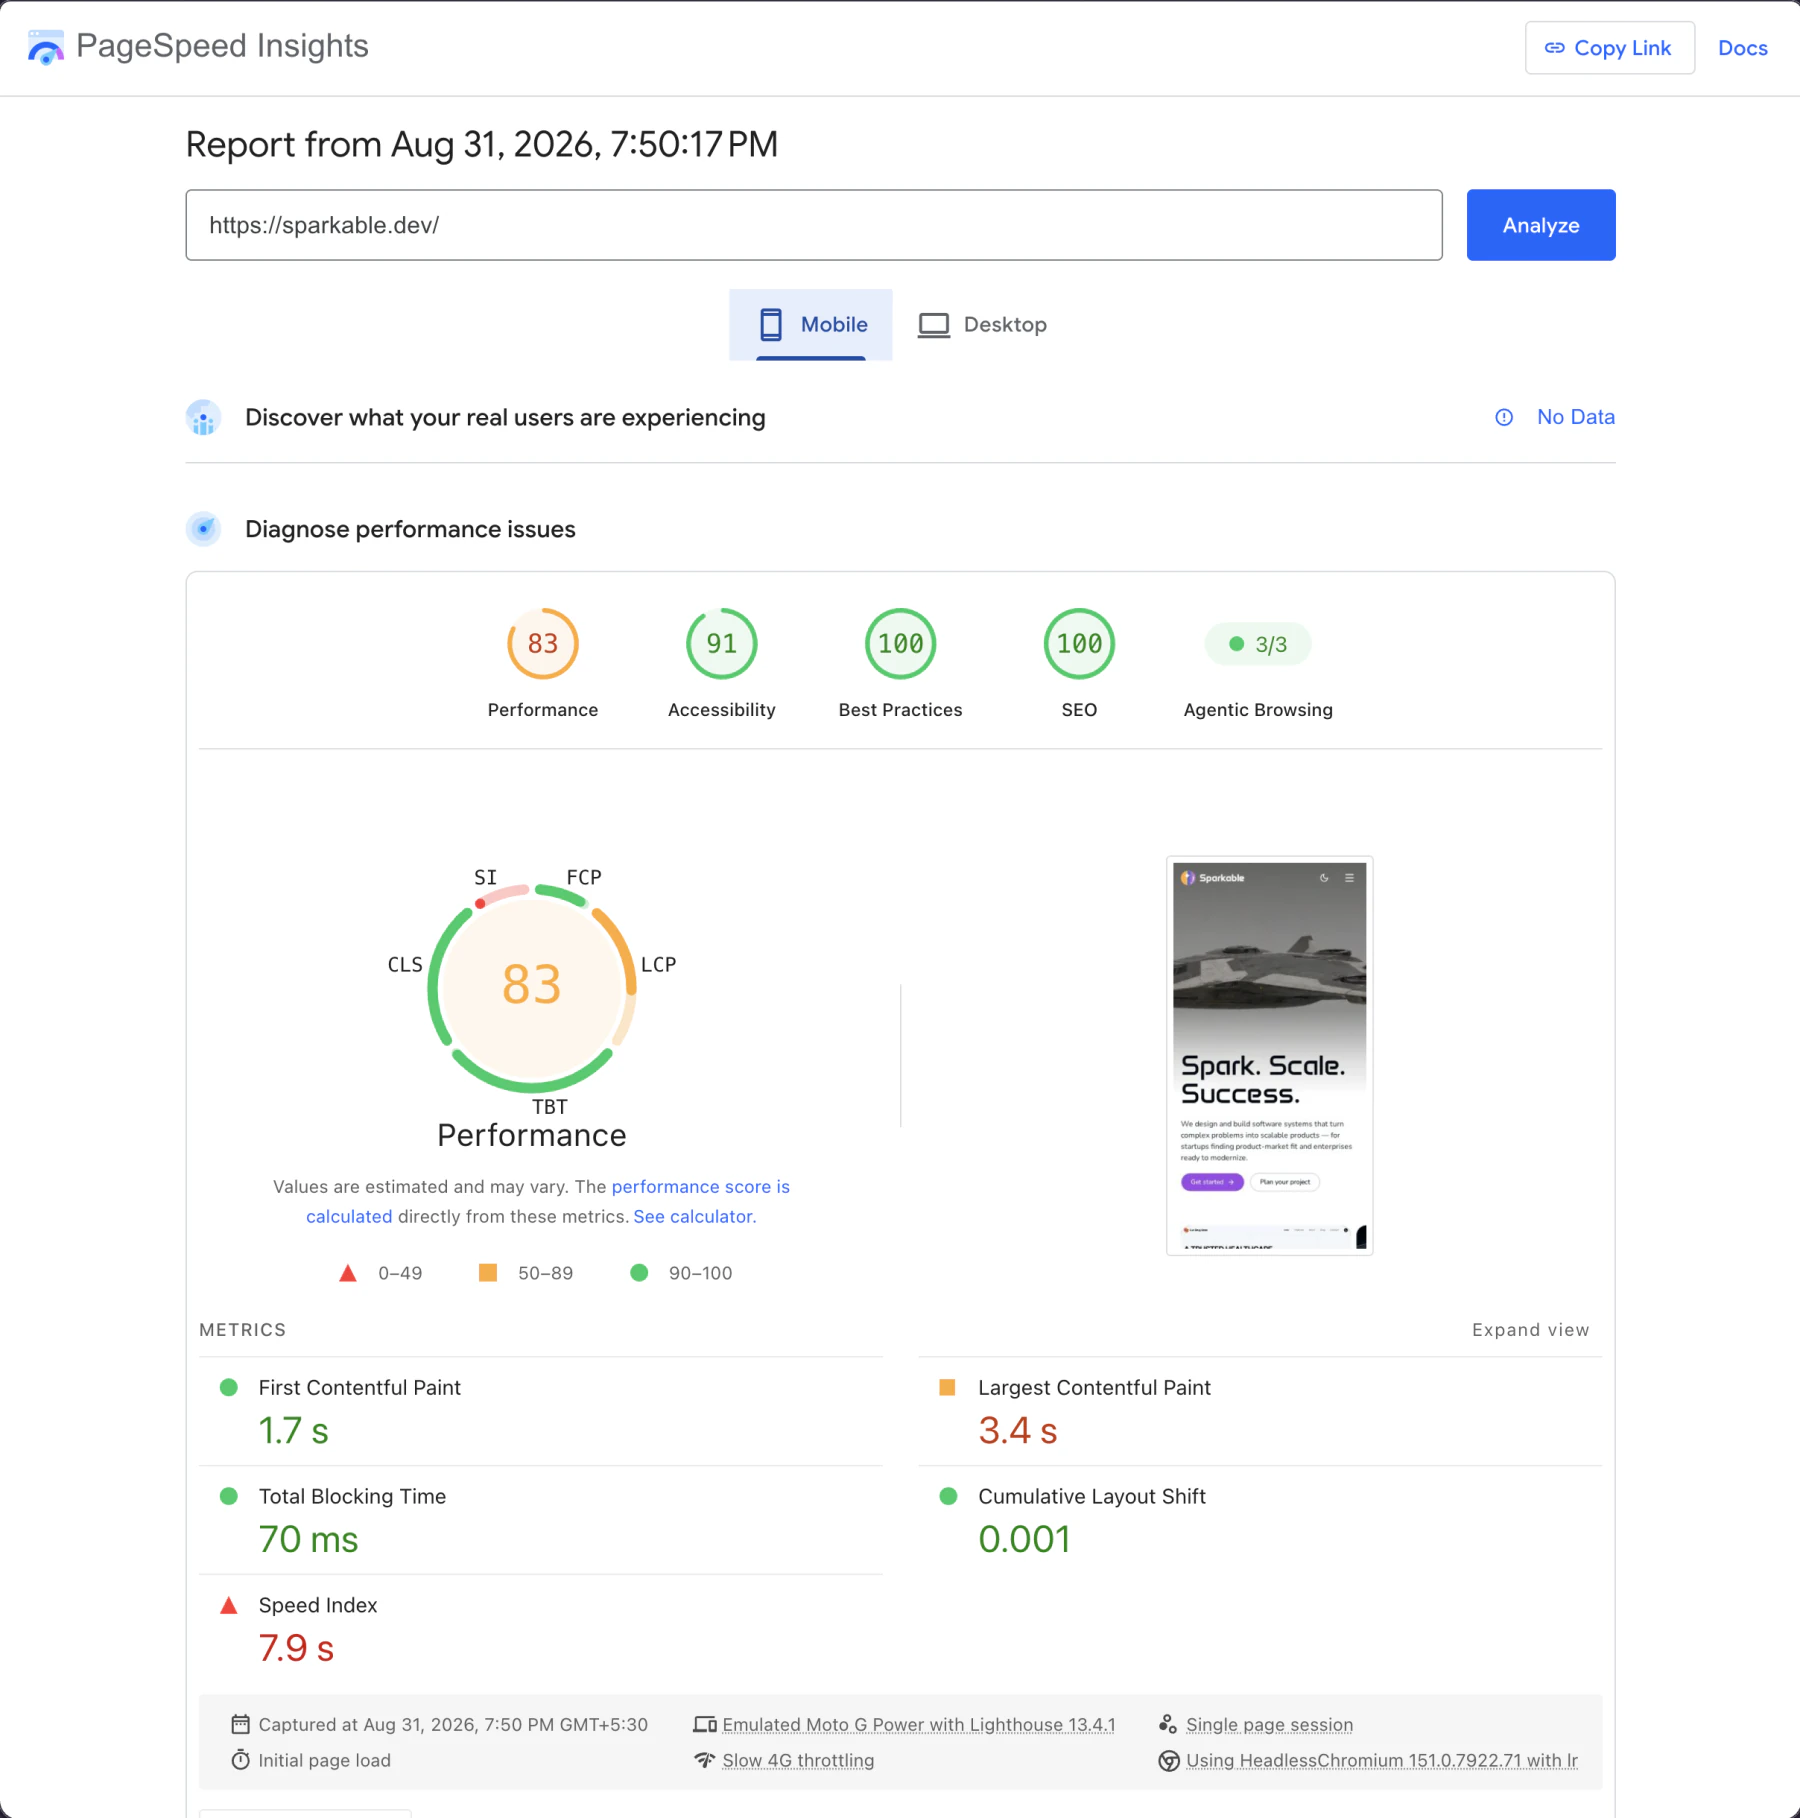
Mobile reached 83, but LCP and Speed Index still needed work.
The remaining weakness sat above the fold. We had compressed the video and added a poster, but the browser still treated the video as immediate media. The first pass also kept a React mobile-menu island and loaded article-only CSS through the shared stylesheet.
This was the point where small changes mattered more than another rewrite.
Second pass: make the poster the explicit first visual
The second pass separated the poster from the <video> element. The page now renders an eager 1,280 by 720 image with fetchpriority="high", and src/pages/index.astro preloads the same file.
The video starts without a src and uses preload="none". Its mobile and desktop paths live in data attributes. A small script selects one path after the critical work settles:
<video
  data-mobile-src="/videos/hero-spaceship-v2-mobile.mp4"
  data-desktop-src="/videos/hero-spaceship-v2-desktop.mp4"
  preload="none"
  autoplay
  muted
  loop
  playsinline
></video>
requestIdleCallback schedules the source assignment, with a short timeout fallback. The script never places both source URLs in the video element, so a phone cannot choose or speculate on the desktop file.
The poster stays visible until the video fires loadeddata. CSS then fades the video over the poster. If autoplay fails, the poster remains a valid visual instead of leaving a blank area.
The script also pauses video playback when the hero leaves the viewport or the document becomes hidden. Astro’s page lifecycle runs cleanup before the next page binds a new observer or media listener.
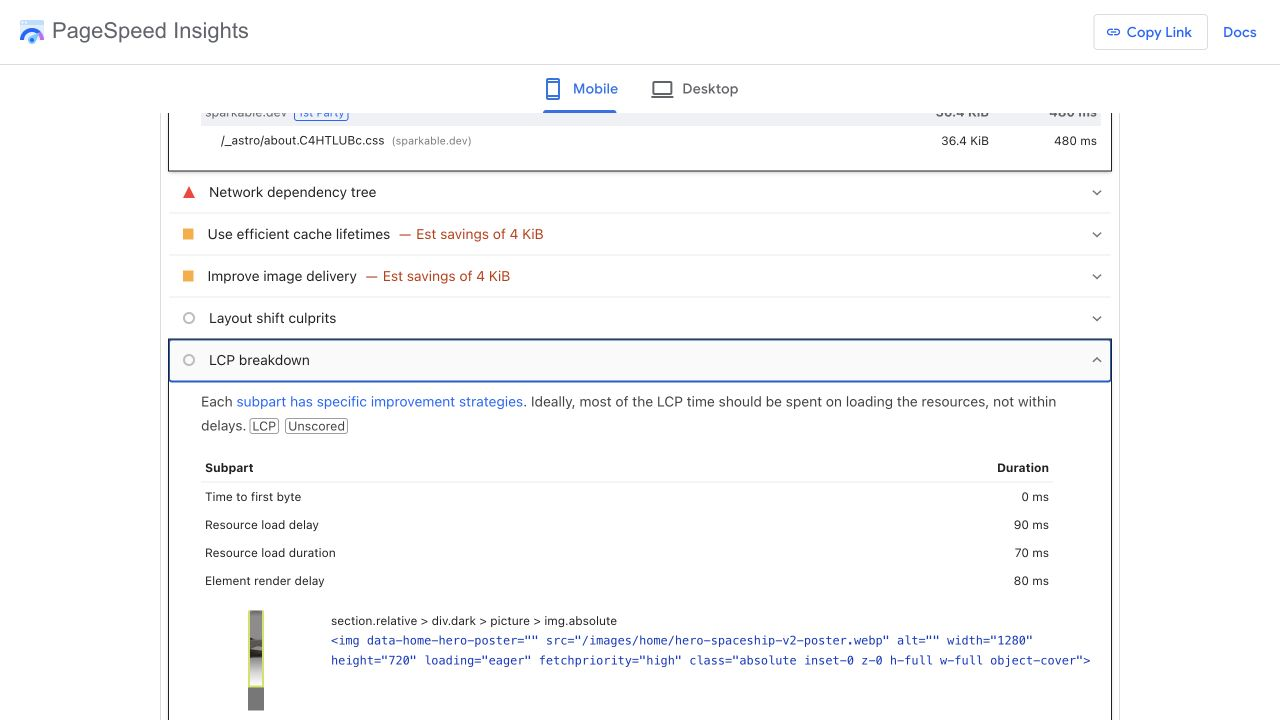
The final mobile LCP audit identifies the 18,256 byte poster as the LCP element. The saved breakdown displayed 0 ms TTFB, 90 ms resource-load delay, 70 ms resource-load duration, and 80 ms element-render delay for that element.
Second pass: remove React from the mobile menu
The mobile menu was a React button and Sheet composition hydrated with a media query. It worked, but the interaction did not require React state, a dialog library, or a client bundle.
We replaced it with MobileMenu.astro. The component keeps the same navigation groups, accordion behavior, focus handling, scroll lock, close action, and Astro navigation lifecycle. It uses HTML, CSS, and a bounded script.
This was not a new design. It was the same menu with a smaller runtime contract.
Second pass: stop homepage visitors from paying for article CSS
The shared stylesheet contained 294 lines for article tables, Mermaid diagrams, ApexCharts, figure toolbars, fullscreen viewers, blog hero surfaces, and table-of-contents scrollbars.
We moved those rules into content.css and imported that file only from blog posts, the blog index, case studies, and the Markdown example page. The homepage keeps the global design system without loading article-only rules.
We also preloaded the Anta heading font from its build URL. The font was already part of the design, so the task was earlier discovery, not a font change.
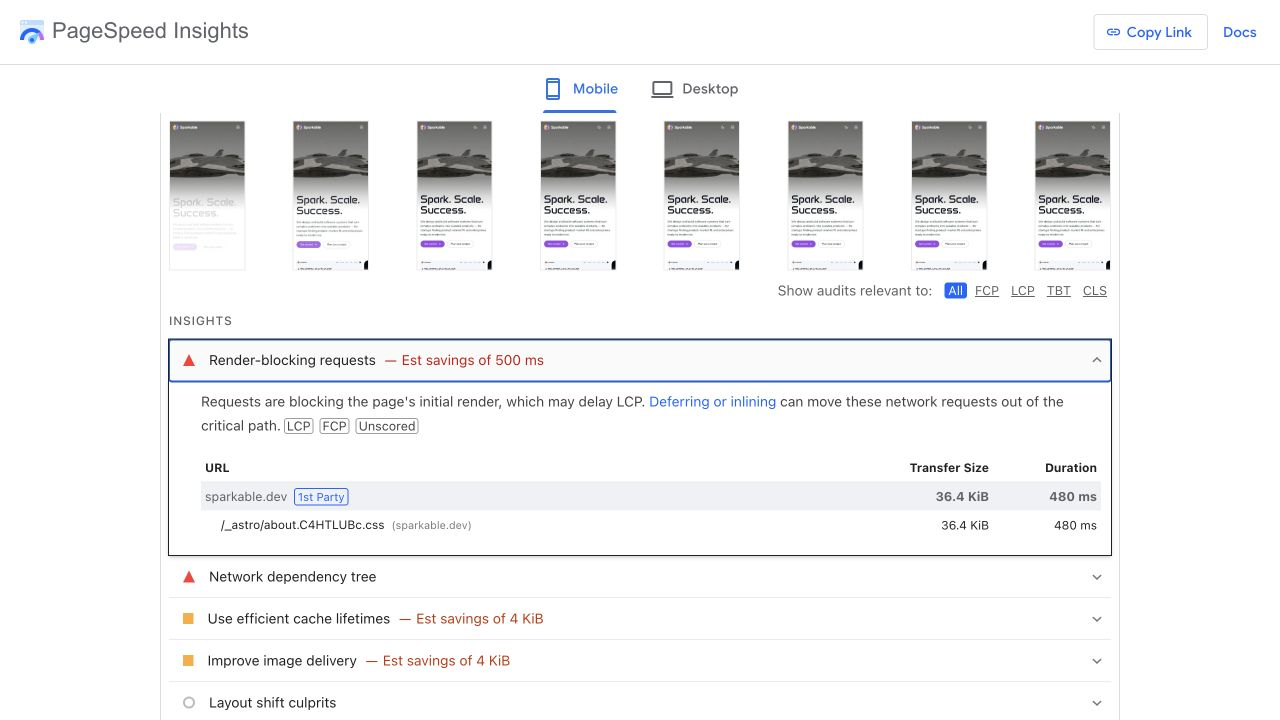
PageSpeed still identifies the 36.4 KiB compiled homepage stylesheet as render blocking on mobile and estimates 430 to 510 milliseconds of potential savings. The second pass reduced shared CSS scope, but it did not solve critical CSS extraction.
We improved a review interaction while touching the island
The social-proof section already hydrated only near the viewport. On mobile, the review carousel depended on swipe gestures, but the interface did not tell visitors that more cards existed.
We added a compact mobile navigator with previous and next buttons and a live Review 1 of 4 position. The controls reuse the existing carousel API. The rating row now aligns cleanly on small screens, and the review call to action uses the available width.
This change did not move the performance score. It protected usability while the performance work was already touching the same component.
The final result is a distribution, not one green circle
We ran three distinct PageSpeed tests after deployment and used the median for each metric.
Mobile PageSpeed runs
| Run | Score | FCP | LCP | TBT | CLS | Speed Index |
|---|---|---|---|---|---|---|
| 1 | 93 | 1.8 s | 2.9 s | 100 ms | 0 | 1.8 s |
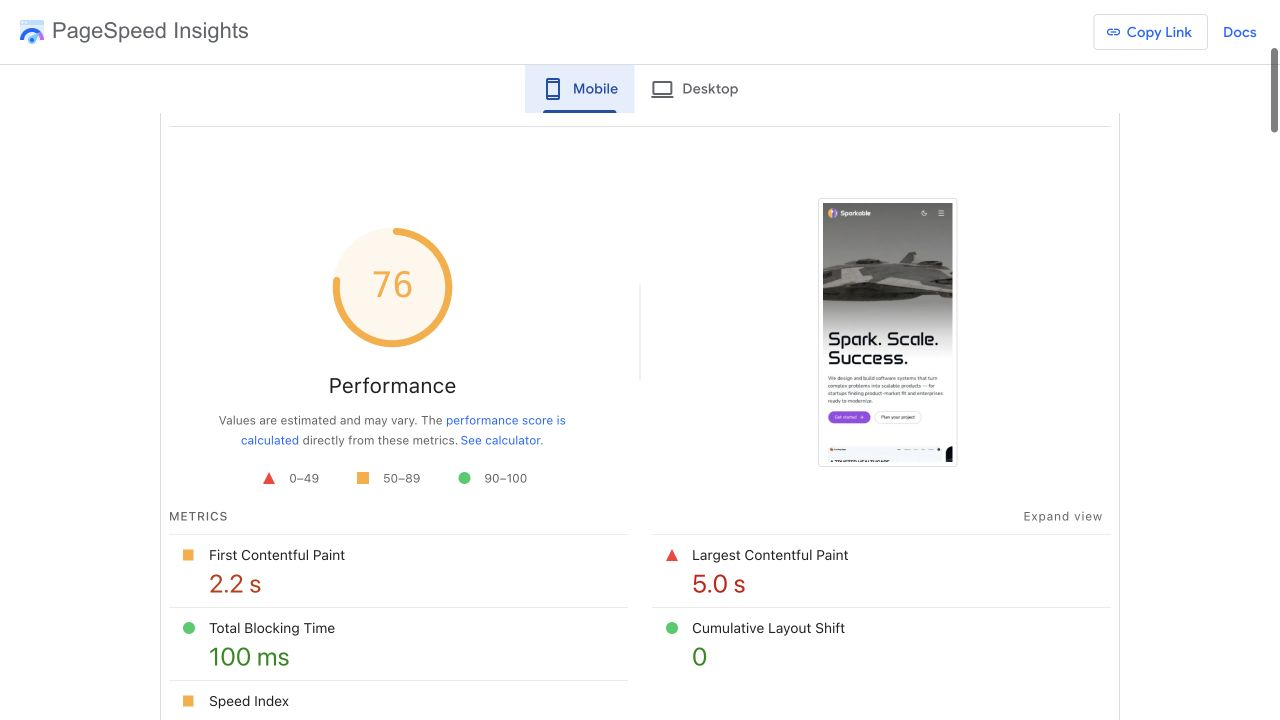
| 2 | 76 | 2.2 s | 5.0 s | 100 ms | 0 | 4.6 s |
| 3 | 97 | 1.8 s | 2.1 s | 120 ms | 0 | 1.8 s |
| Median | 93 | 1.8 s | 2.9 s | 100 ms | 0 | 1.8 s |
Desktop PageSpeed runs
| Run | Score | FCP | LCP | TBT | CLS | Speed Index |
|---|---|---|---|---|---|---|
| 1 | 98 | 0.5 s | 0.7 s | 120 ms | 0.001 | 0.5 s |
| 2 | 63 | 0.7 s | 0.8 s | 990 ms | 0.141 | 1.6 s |
| 3 | 95 | 0.5 s | 0.7 s | 170 ms | 0 | 0.7 s |
| Median | 95 | 0.5 s | 0.7 s | 170 ms | 0.001 | 0.7 s |
The three reports are preserved at run 1, run 2, and run 3.
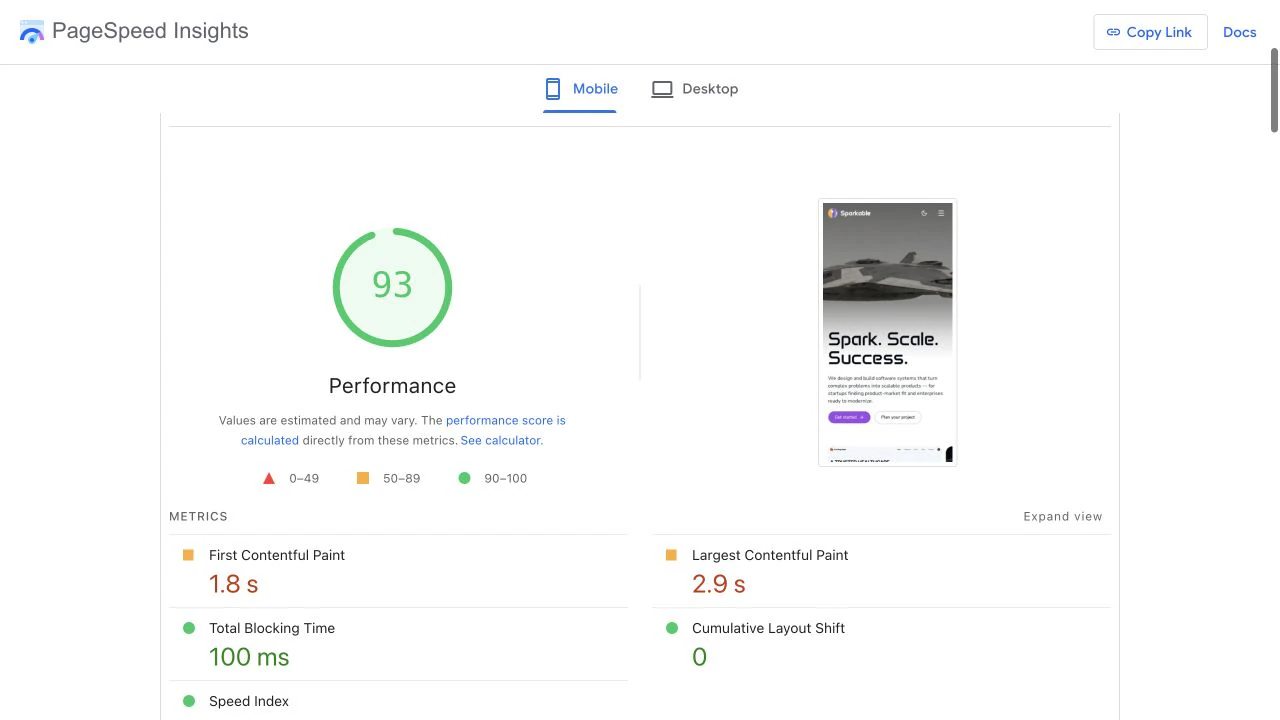
Mobile median: 93.
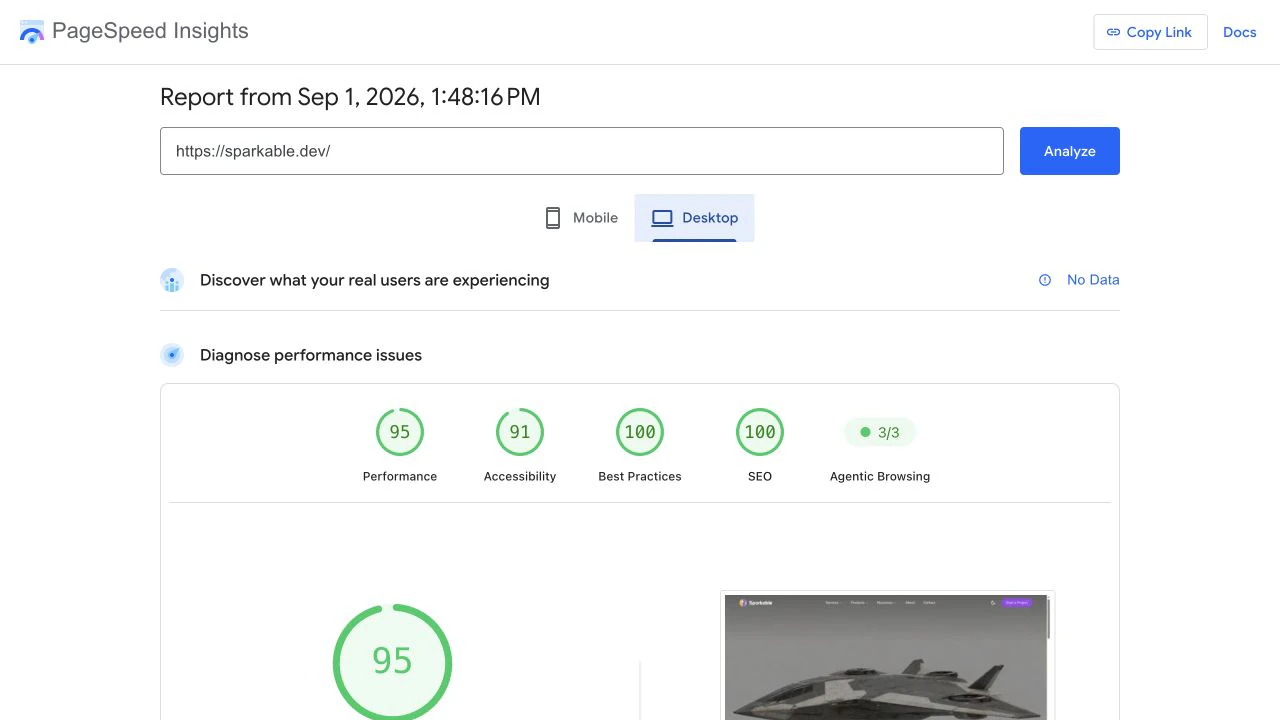
Desktop median: 95.
The low run matters. Mobile fell to 76. Desktop fell to 63, with 990 ms TBT, 0.141 CLS, 3.3 seconds of main-thread work, and a 2,931 KiB payload.
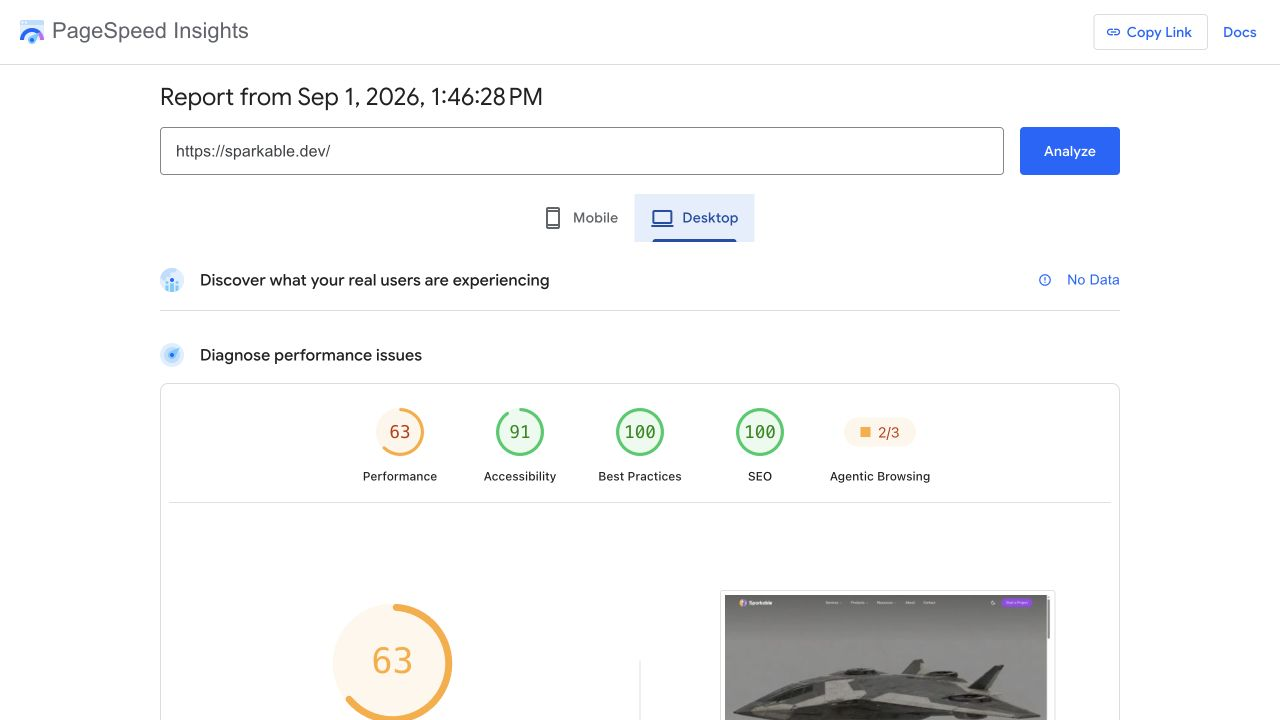
Before and after, using medians
| Metric | Desktop before | Desktop after | Change | Mobile before | Mobile after | Change |
|---|---|---|---|---|---|---|
| Performance score | 56 | 95 | +39 points | 42 | 93 | +51 points |
| FCP | 0.5 s | 0.5 s | 1.8% lower | 2.1 s | 1.8 s | 14.2% lower |
| LCP | 1.4 s | 0.7 s | 46.9% lower | 4.8 s | 2.9 s | 38.7% lower |
| TBT | 20,640 ms | 170 ms | 99.2% lower | 32,750 ms | 100 ms | 99.7% lower |
| CLS | 0.007 | 0.001 | 85.7% lower | 0 | 0 | No change |
| Speed Index | 10.9 s | 0.7 s | 93.1% lower | 8.5 s | 1.8 s | 78.8% lower |
The percentage calculations use the exact median values stored in the evidence pack. The table rounds values for reading.
Google defines good field thresholds as LCP within 2.5 seconds, INP at 200 milliseconds or less, and CLS at 0.1 or less at the 75th percentile. Lighthouse cannot measure INP without a real interaction, so it uses TBT as a lab proxy. Read the current Web Vitals guidance.
Our mobile median LCP of 2.944 seconds is still outside the good field threshold. More important, PageSpeed reports no field data. We cannot say that the homepage passes Core Web Vitals for real users.
Pingdom became smaller because the work became deferred
The new Pingdom test from San Francisco reported A91, 353.2 KB, 353 milliseconds, and 14 requests.
| Pingdom metric | Original | Final | Change |
|---|---|---|---|
| Performance grade | B88 | A91 | +3 points |
| Page size | 858.7 KB | 353.2 KB | 58.9% lower |
| Load time | 256 ms | 353 ms | 37.9% higher |
| Requests | 10 | 14 | +4 |
| HAR response-body sum | 852,414 B | 344,435 B | 59.6% lower |
| HAR decoded-content sum | 1,488,895 B | 1,017,459 B | 31.7% lower |
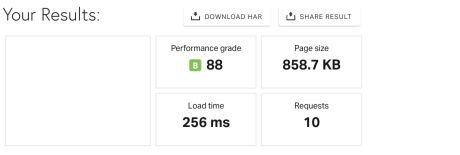
Original network result.
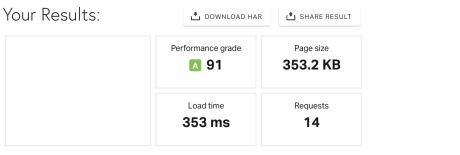
Final network result.
The final Pingdom result needs a caveat. Its 437 millisecond fully-loaded marker occurred before either hero video and the second /eeic tag payload loaded. The measurement proves that the initial path became smaller. It does not represent a full scrolling session.
A longer DataForSEO desktop profile recorded 1,803,290 transferred bytes across 36 requests. Media accounted for 1,160,638 bytes and scripts for 482,344 bytes. That run included the desktop hero video and both tag payloads.
The tools answer different questions:
- Pingdom shows the early request waterfall from one location.
- PageSpeed simulates a device and network, executes JavaScript, and produces lab metrics.
- DataForSEO supplied a second Lighthouse desktop profile and a complete request list.
- None of them replaces first-party real-user monitoring.
The remaining long tasks belong to analytics
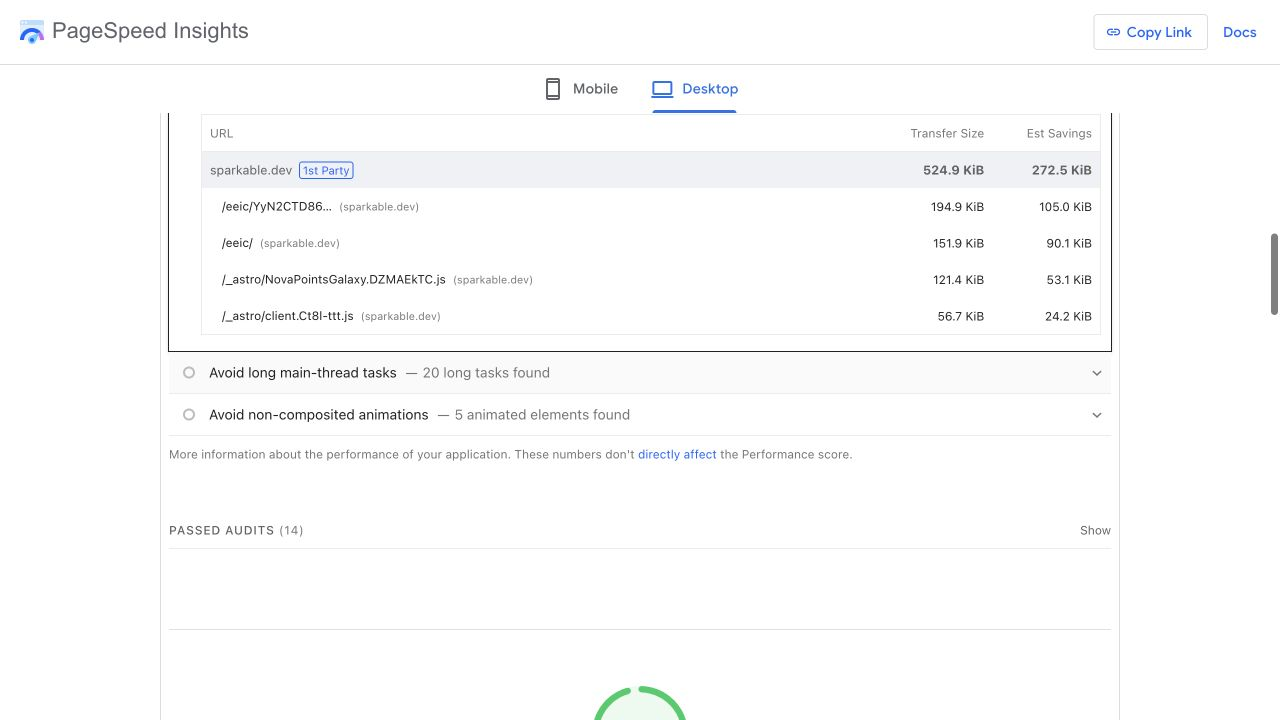
The final median mobile long-task audit contains two entries. Both come from the injected /eeic Google tag path. They lasted 157 ms and 93 ms.
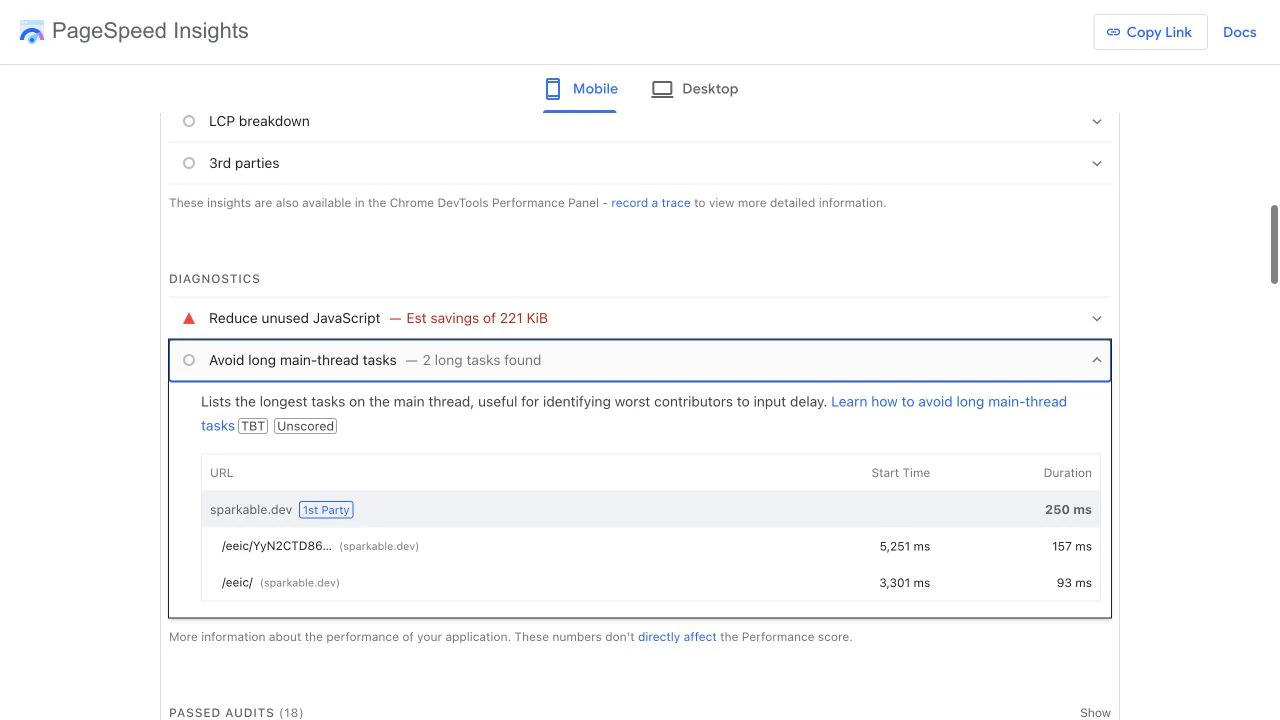
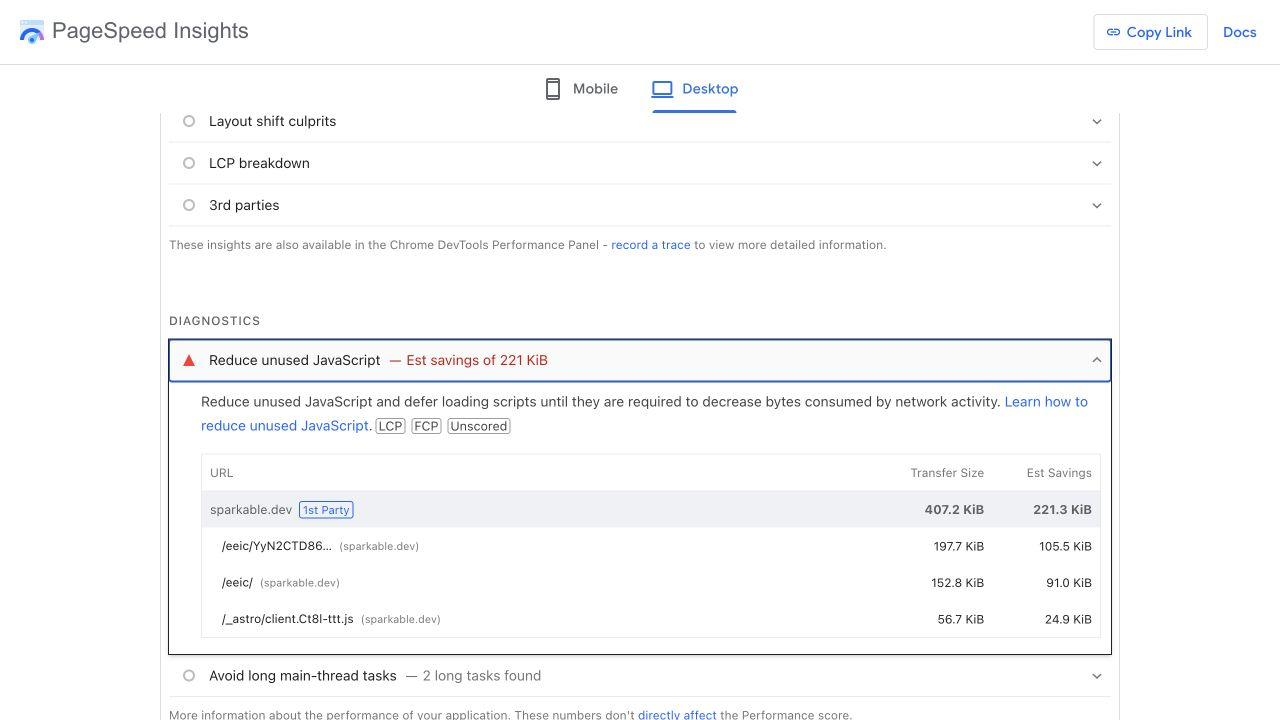
PageSpeed estimates 221.3 KiB of unused JavaScript:
| Current script | Transfer | Estimated unused |
|---|---|---|
/eeic/YyN2CTD86... | 197.7 KiB | 105.5 KiB |
/eeic/ | 152.8 KiB | 91.0 KiB |
| Shared React runtime | 56.7 KiB | 24.9 KiB |
| Total | 407.2 KiB | 221.3 KiB |
We deliberately left the tag injection and Cloudflare analytics in place during the performance pass. Removing them could break attribution, and their configuration lives outside the homepage source. The next step is to audit whether every tag is required and correctly configured, then change the tag layer as its own measured release.
What the score can and cannot do for growth
A PageSpeed score above 90 does not create traffic or clients by itself.
Google says Core Web Vitals are used by its ranking systems and recommends good Core Web Vitals for Search and user experience. Google also states that strong PageSpeed or Core Web Vitals reports do not guarantee top rankings. Relevance, content quality, and the wider page experience still matter. Read Google’s page-experience guidance.
That makes this work useful, but not magical.
The faster homepage removes a technical obstacle. It makes the first interaction less likely to be dominated by long JavaScript tasks, reduces transfer waste, and improves the site’s ability to serve slower devices. We have not measured whether those changes increased enquiries, search visibility, or conversion.
For a business-impact case study, we would need a clean pre-release analytics baseline, first-party field Web Vitals, conversion events, and enough time after deployment to control for campaign and content changes. We did not have those inputs.
What we would do differently
Instrument field performance before the redesign
The largest evidence gap is real-user data. PageSpeed reported No Data before and after the work. We should have installed first-party Web Vitals collection before the visual redesign, then compared mobile and desktop distributions at the 75th percentile.
Google recommends collecting field data because lab tools cannot represent the full mix of user devices, networks, and interactions. A future pass should send LCP, INP, and CLS from the web-vitals library to an analytics endpoint, with release and page identifiers.
Set a media budget before approving the hero
The 8.14 MB video should never have reached production. A simple budget for above-the-fold media would have caught the problem before PageSpeed did.
The redesign review focused on visual direction and interaction. The performance review came later. Those reviews should happen together for any autoplay hero.
Test three times at every release gate
The final score range was wide: 76 to 97 on mobile and 63 to 98 on desktop. One green screenshot would have hidden that instability.
We now treat PageSpeed as a distribution. Three runs are the minimum for a release comparison. The raw values, report URLs, screenshots, and median calculation stay together.
Keep accessibility in the same release gate
Accessibility moved from 96 to 91 while performance and SEO improved. The final automated findings include contrast, touch-target spacing, and heading order.
This case study does not present a lower accessibility score as an acceptable performance trade. Those findings need a separate correction pass with visual and keyboard review.
Separate application work from tag work
The final long-task table gives us a cleaner boundary. The homepage application is no longer the main blocking source. The tag layer is.
That separation makes the next decision safer. We can audit attribution requirements, remove duplicate or broken tags, and measure the result without mixing the change with a homepage rewrite.
What the project changed in our engineering process
This project changed more than one route.
We now start performance work by asking five concrete questions:
- What is the LCP element on each viewport?
- Which resources enter the initial critical path?
- Which components need JavaScript before the visitor reaches them?
- Which animations continue when they are off-screen or hidden?
- Which measurement proves the result, and what does that measurement leave out?
The fifth question matters most. Pingdom looked fast while the old browser was blocked. The redesign looked responsive while mobile waited for an 8 MB video. The final green medians still contained a low outlier and no field data.
Performance is not one number. It is the relationship between network delivery, main-thread work, rendering, interaction, and the conditions under which we measured each one.
The result
We kept the spacecraft hero, the portfolio, the comparison story, the reviews, the terminal, the header, the theme, and the footer behavior.
We changed who owns the page and when the browser pays for each part.
- Astro owns the static homepage structure.
- React loads only for interactive islands near the viewport.
- The poster owns the first hero paint.
- One responsive video loads after critical work.
- Images match their rendered sizes.
- Animations stop when they are not visible.
- Versioned assets stay cached for one year.
- Dated evidence preserves the good runs, the bad run, and the limits of every tool.
The final PageSpeed medians are 93 on mobile and 95 on desktop. Median TBT is 100 ms on mobile and 170 ms on desktop. Pingdom reports A91 and a 353.2 KB initial waterfall.
The stronger outcome is less visible: the homepage no longer depends on a continuous galaxy render or one eager React application to become usable.
That is the part we can defend with evidence.